Energy sector AI: when your data comes from a grid, not a factory floor
Energy sector AI productionization needs distributed, time-sensitive, weather-aware pipelines. Grid data is not plant data, and the AI architecture must reflect that

13
min read

Energy AI pipelines must account for distributed assets, grid events, renewable variability, demand signals, weather, forecasting, and operational deployment. Grid data is not factory-floor data, and that changes how AI must be built, deployed, and governed.
In our experience working with power generation companies, renewable independent power producers, grid infrastructure manufacturers, and energy utilities, the energy sector has more data than almost any other industry. SCADA feeds run continuously across hundreds of assets. Smart meters generate consumption data at scale. Weather feeds, demand curves, generation telemetry, grid sensors, and asset condition data accumulate by the minute. The volume is rarely the issue. Usable data, fit for the operational decision the AI is meant to support, is a very different story.
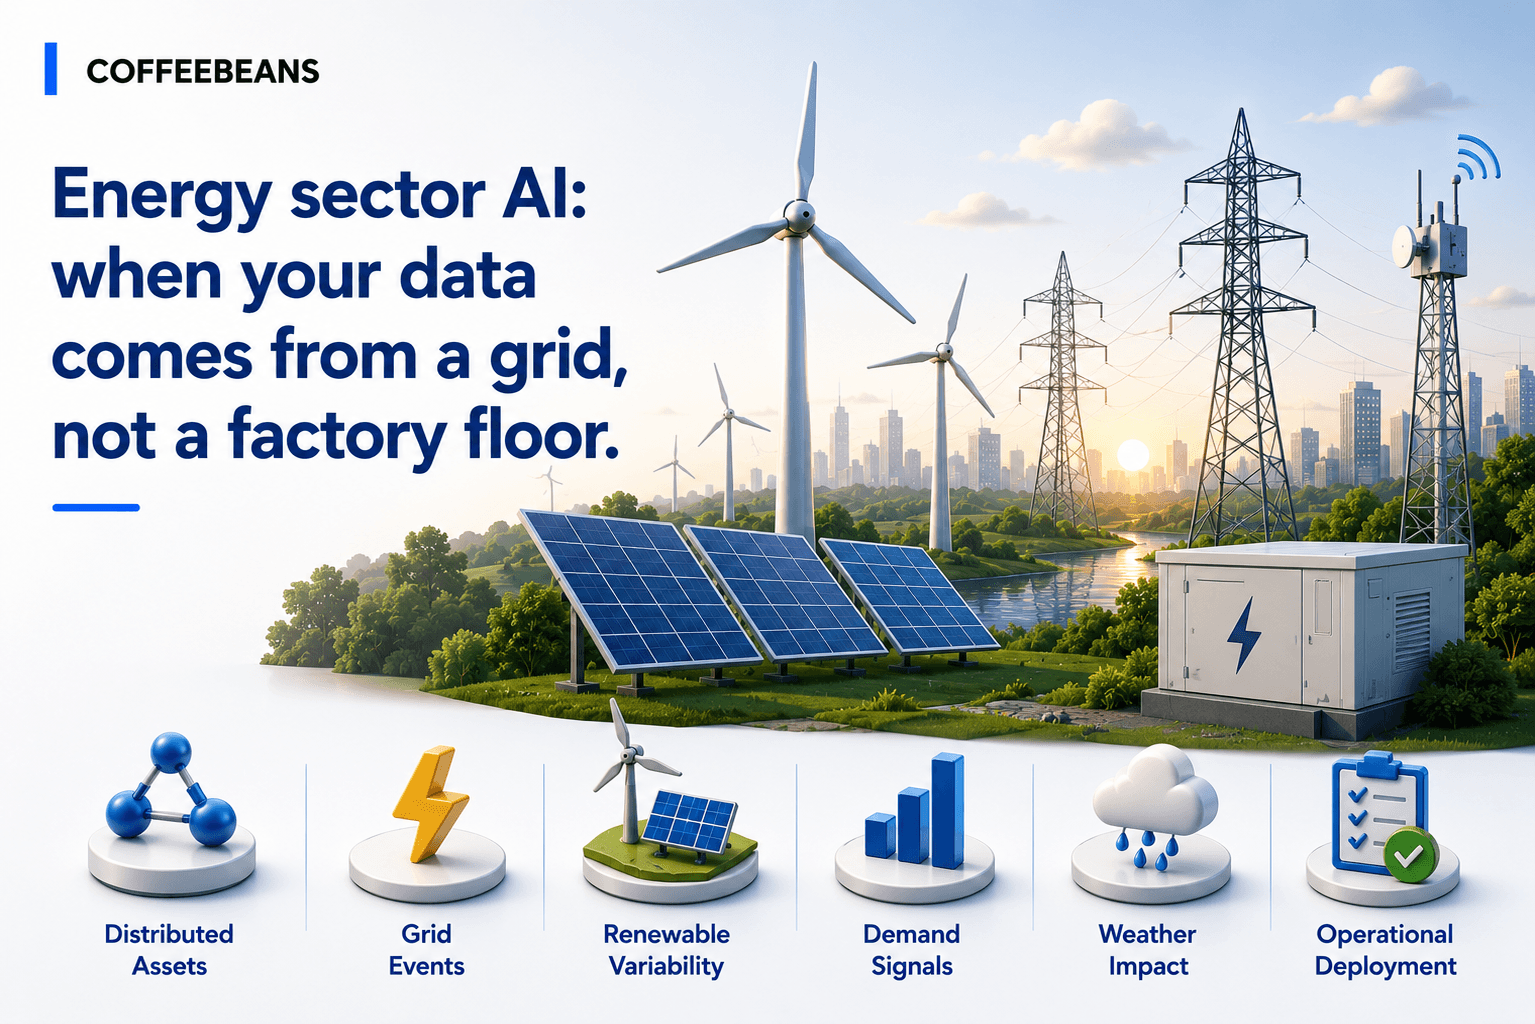
This series has explored how industry context changes the AI pipeline. This week turns to energy, where the structural difference is operational geometry. A factory has a bounded production environment with localised data sources. A grid does not. It is a distributed operating system, with assets across geographies, output that depends on weather and demand the operator cannot control, and decisions that must be made on time horizons ranging from milliseconds (grid stability) to days (load forecasting) to years (capacity planning). An AI pipeline that does not reflect this reality may produce promising proofs of concept, but it will struggle to support the operational decisions where energy AI delivers value.
|
Grid data and plant data behave differently
The structural differences that change the AI approach
Energy data is structurally distinct from the plant and process data most industrial AI teams have built pipelines for. The differences are not subtle, and they cumulatively reshape the AI architecture.
Plant or factory-floor data | Grid and energy data |
Bounded production environment with defined process boundaries. | Distributed assets across geographies, with network effects between them. |
Localised data sources, typically tightly time-synchronised. | Many sources from SCADA, smart meters, weather feeds, and grid sensors with different time bases and latencies. |
Controlled operating environment, weather usually irrelevant. | Output and demand are weather-influenced and externally driven. |
Repeatable equipment workflows on the same line. | Renewable intermittency, demand variability, and grid events that recur but with different magnitudes. |
Decisions are mostly internal to the plant. | Decisions involve dispatch, planners, control room, field operations, and external grid operators. |
The Indian energy sector value chain heatmap that we maintain identifies power generation and plant operations and grid integration and transmission as the two stages where AI investment intensity is highest. Both of these stages depend on the grid-data realities above. Solar and wind manufacturers concentrate AI in their own component manufacturing and growing O&M operations. Renewable IPPs and grid operators concentrate AI in generation operations, dispatch, and grid integration. Each of these is a different operational decision; each requires a different pipeline.
Why energy data is harder than it first appears
Volume is not the bottleneck. Operational meaning is.
In our experience, the data challenges that cause energy AI initiatives to stall are consistent across power generation companies, renewable IPPs, and grid infrastructure operators:
Data comes from many assets and locations. A renewable IPP may operate solar parks, wind farms, and storage assets across multiple states. Each site has its own SCADA, its own historian, and its own data quirks.
Time synchronisation is difficult. Sensor data, smart meter reads, weather feeds, and grid events arrive on different cadences. Aligning them to a single timeline that an ML model can learn from is a foundational engineering task, not a trivial one.
Weather and demand drive operations. Generation output, especially from solar and wind assets, depends on external conditions the operator does not control. Demand patterns shift with weather, time of day, season, and economic conditions.
Renewable generation changes quickly. A cloud passing over a solar park can change output within seconds. A wind ramp can shift turbine generation over minutes. The model has to handle this without producing operational noise.
Grid events are rare but high impact. The outage, the frequency excursion, the protection trip. These are the events the AI is most useful for, and the events training data tends to under-represent.
Sensor coverage is uneven. Newer assets may be densely instrumented; older assets may not be. Generalising a model across both classes is a real engineering problem.
External data must be combined with internal data. Weather forecasts, market signals, and grid operator communications are external inputs the model needs but does not own.
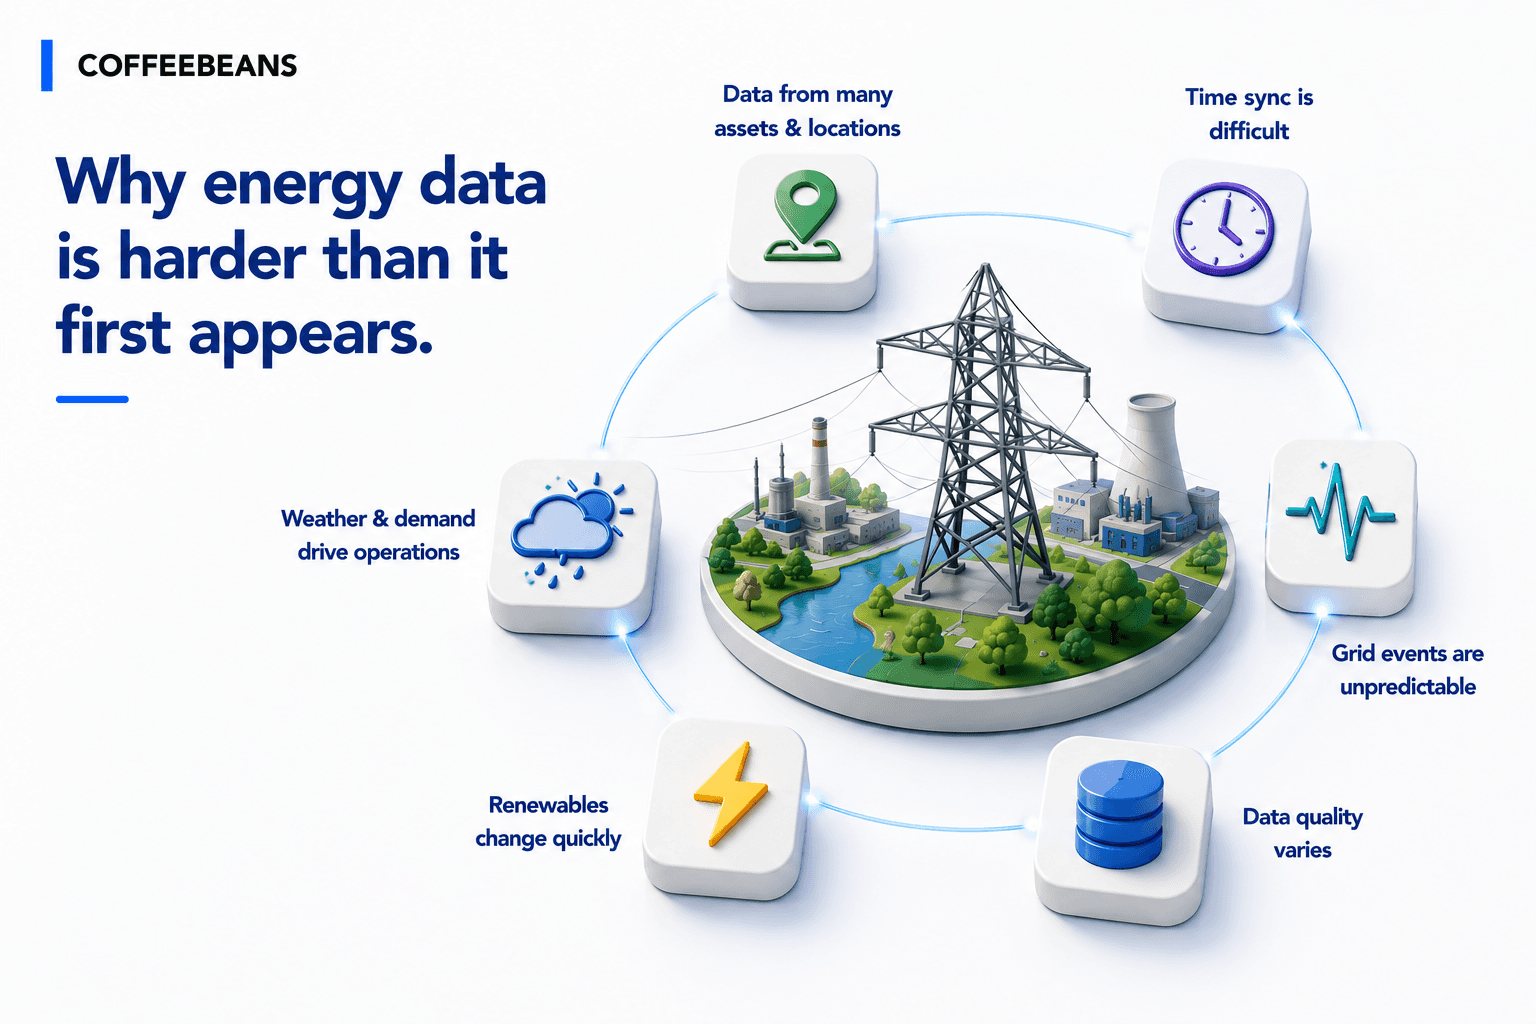
In energy, the data problem is not only inside the plant. It is across the grid, across the weather, across demand, and across the operating tempo of the decision.
Feature engineering across time, geography, and context
Equipment signals alone are not enough
Power grid machine learning feature engineering reaches beyond equipment signals into operational context. Effective features for an energy AI pipeline typically combine the following:
Historical generation patterns by asset class, site, and configuration.
Real-time output telemetry from SCADA, plant historians, and asset management systems.
Weather data and forecasts, including irradiance for solar, wind speed and direction for wind, and ambient temperature for thermal performance.
Demand patterns and load curves decomposed by region, customer segment, and time-of-day.
Asset health indicators from vibration, temperature, and electrical signals.
Maintenance history and work order context to distinguish degradation from post-maintenance behaviour.
Grid signals, including voltage, frequency, and power quality, where the model is operating close to the grid edge.
Curtailment or outage events as both labels and features, depending on the use case.
Geographic and time context, since the same parameter means different things at different sites and at different points in the day or season.
|
Model selection depends on the operational decision
There is no single 'energy AI model'
The model that fits a load forecasting problem is not the model that fits an outage prediction problem. The model that supports dispatch decisions is not the model that supports turbine bearing maintenance. Energy AI is a portfolio of model choices, each calibrated to the operational decision the model is meant to improve. In practical terms, the use cases we see most often include:
Load forecasting for system operators and utility planners, with horizons from intraday to long-term capacity planning.
Renewable generation forecasting for IPPs and traders, calibrated to the dispatch window and market clearing intervals.
Predictive maintenance for turbines, transformers, panels, inverters, and grid assets, where lead time before failure determines maintenance value.
Outage prediction and grid anomaly detection, where rare-event handling and explainability matter as much as raw accuracy.
Energy storage optimisation balancing charge and discharge cycles against price, demand, and renewable availability.
Dispatch and curtailment decision support, where the AI output enters a workflow with a control room operator on the other side.
Asset performance optimisation across distributed renewable portfolios, where capacity factor and degradation tracking determine yield.
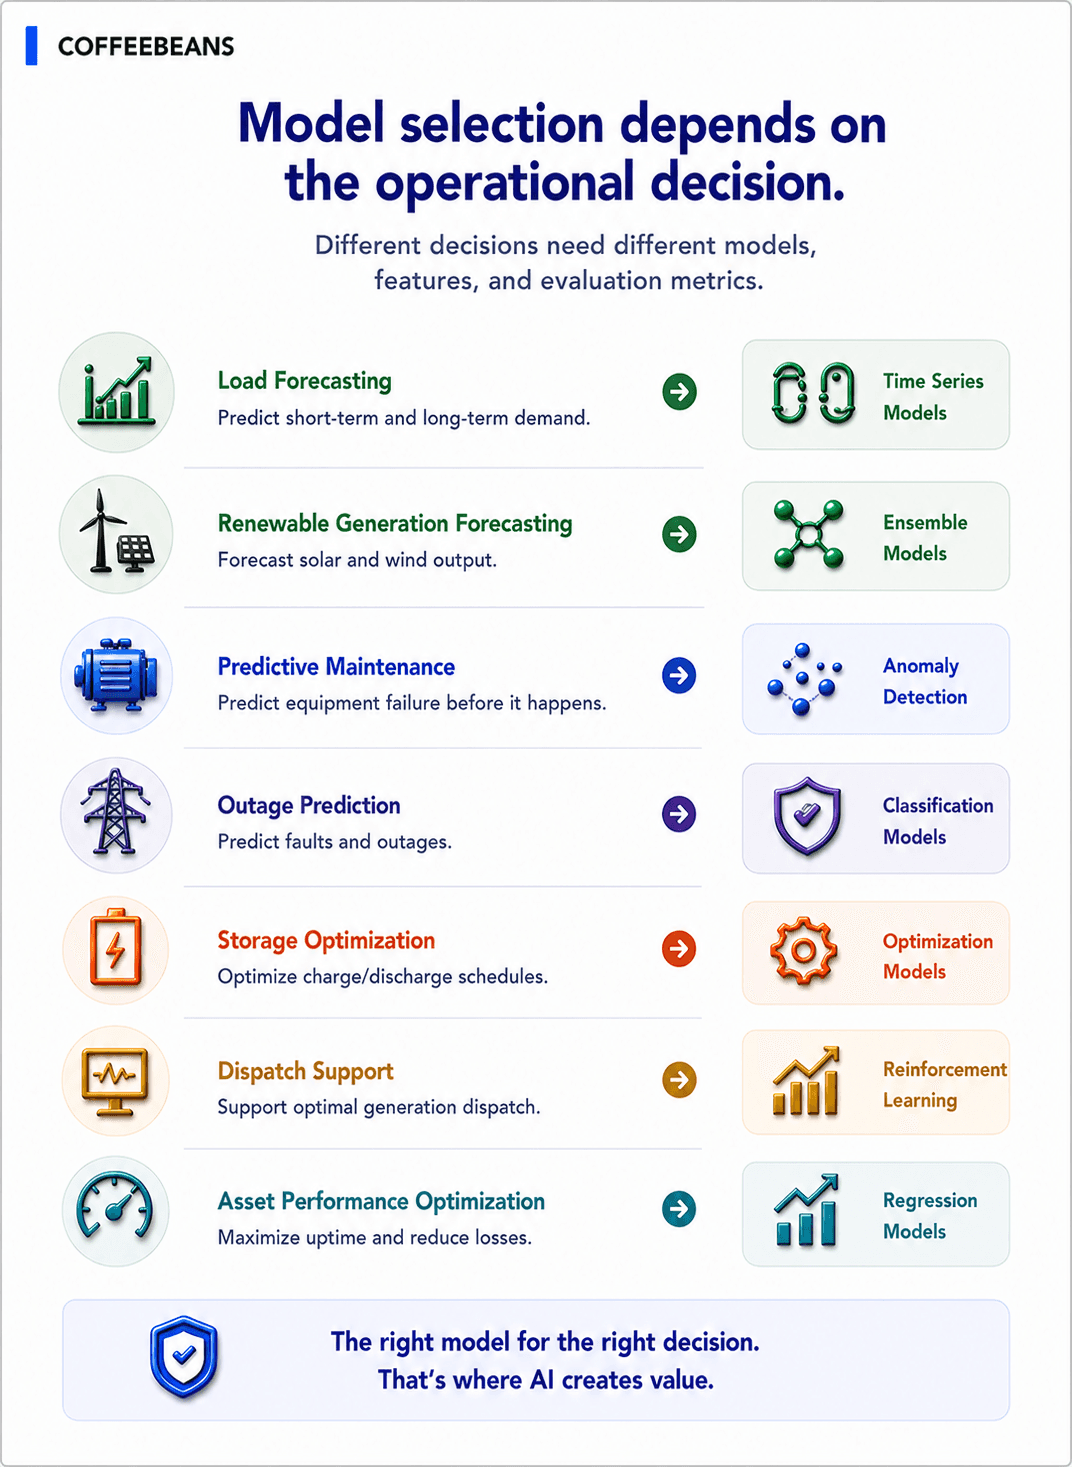
Each of these decisions has its own time horizon, data latency requirement, operational risk profile, and human review pattern. The right model is the one that fits all four. In our experience, the most common mistake in energy AI model selection is reaching for whatever architecture the data science team is most familiar with, rather than starting from the decision and working backward.
Deployment architecture: batch, real-time, edge, and cloud
The inference pattern must match the decision window
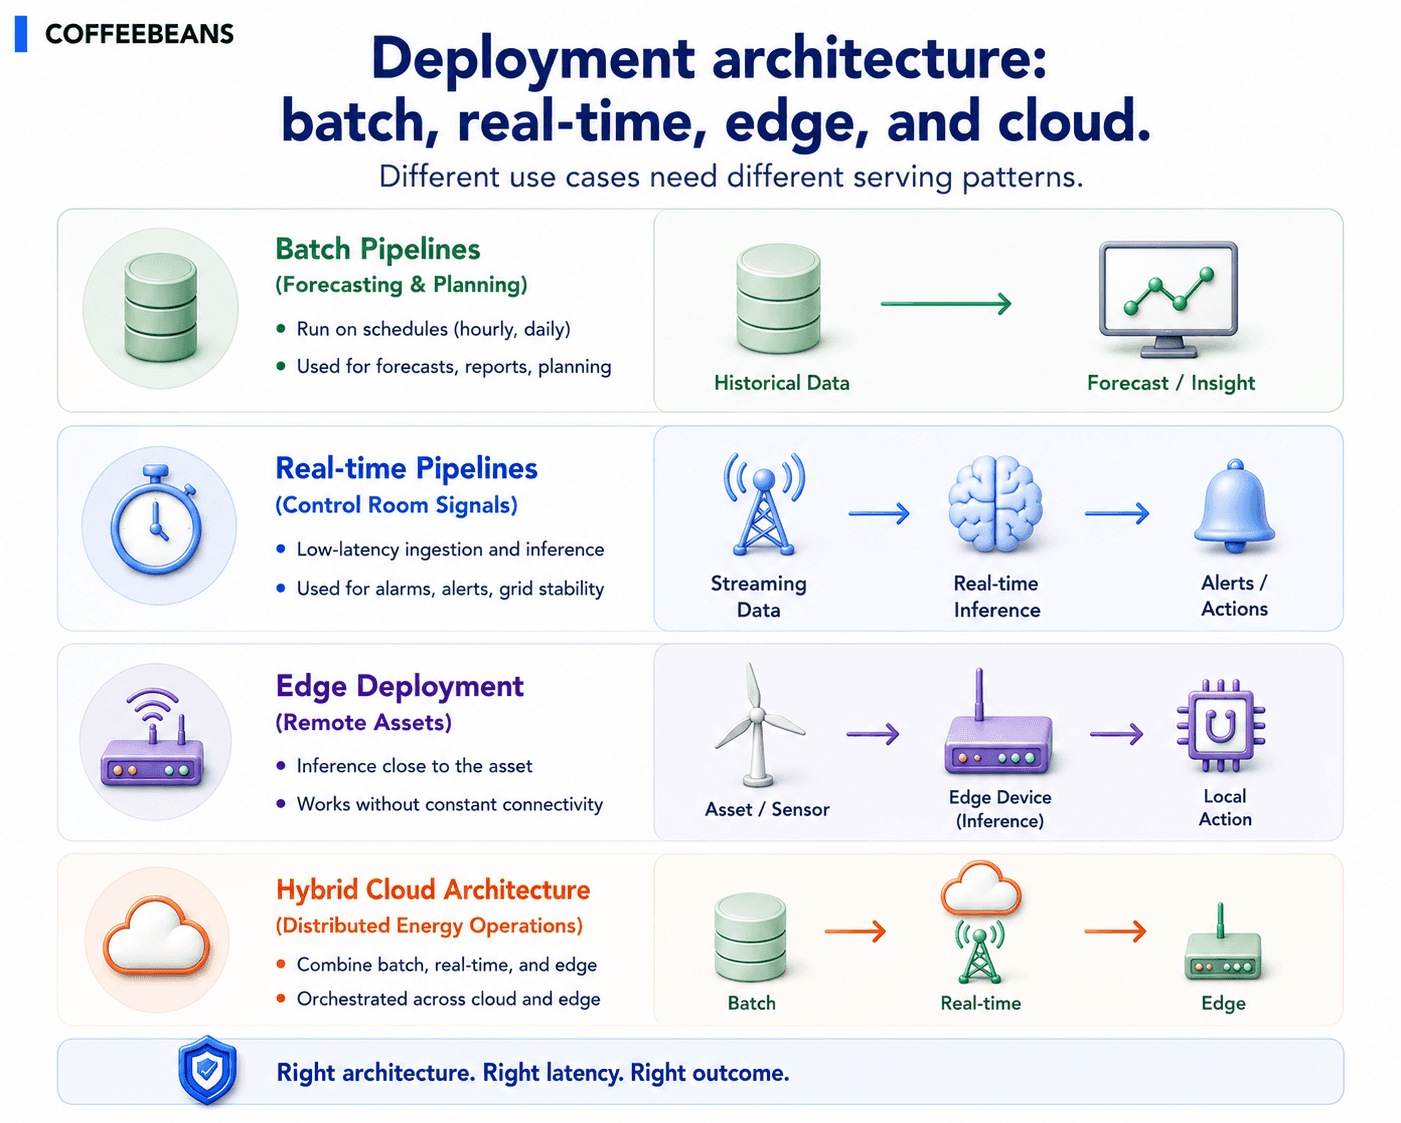
Utility AI deployment decisions live in the choices made about where and how the model runs. A load forecasting model can run as a batch process on a cloud platform, generating predictions overnight for the next day's operations. A control room model supporting grid anomaly detection cannot. It must produce inference within the time window the operator needs to act on it. A predictive maintenance model on a remote wind asset may need to run at the edge because the asset has intermittent connectivity. The same model class can run in three architecturally different ways depending on the operational reality it is serving.
The architectural decisions that follow include the cadence of inference, the placement of computation (cloud, edge, or hybrid), the integration with control room and field operations workflows, alerting and escalation pathways, latency requirements, reliability and uptime expectations, and the human review pattern that sits between the model output and the operational action. None of these is a technical detail. They are part of the model's value, because a prediction that arrives too late or in the wrong workflow is operationally worth zero.
Faster inference is not always better. The inference pattern must match the decision window, and the model must reach the right operator, planner, dispatcher, or maintenance team at the right time.
The six-stage framework, adapted for energy
Same framework, distributed implementation
The CoffeeBeans AI Productionization Value Chain applies to energy in the same structural way it applies to mining, chemicals, and pharma. What changes is how each stage is implemented when the data comes from a grid rather than a plant.
Stage | What it requires in the energy sector |
Stage 01: Data Readiness and Trust | Connect SCADA, plant historian, asset management, smart meter, weather, demand, and grid event data into a governed view. Time synchronisation across distributed sources is the foundational discipline. |
Stage 02: Signal Creation and Data Prep | Features reflect time, geography, asset behaviour, demand, weather, and grid context. Seasonality, time-of-day, and external conditions are first-class inputs, not afterthoughts. |
Stage 03: Model Building and Experimentation | Models are built around the operational decision: forecasting, predictive maintenance, anomaly detection, dispatch support, or storage optimisation. Rare grid events shape baseline and evaluation choices. |
Stage 04: Pre-Production Sign-off | Validation covers seasonal variation, rare grid events, renewable intermittency, operational risk, and human review requirements for the dispatcher, planner, or maintenance team that will act on the output. |
Stage 05: Model Deployment and Serving | Deployment fits the decision: batch for forecasting and planning, real-time for control room signals, edge for remote or latency-sensitive assets. Workflow integration matters as much as the inference itself. |
Stage 06: Model Health and Performance | Monitoring tracks input freshness, prediction quality, and operational feedback as conditions change: weather, demand patterns, asset ageing, grid reconfiguration, and seasonal load shifts. |
In Indian energy, the heatmap intensity is concentrated in power generation and plant operations and in grid integration and transmission, because that is where operational decisions are most data-rich and most consequential. Solar and wind manufacturers concentrate their own AI investment in component manufacturing and O&M, where computer vision QC, predictive maintenance, and digital twins are now category table stakes. Renewable IPPs concentrate AI in generation operations, dispatch, and integration with grid operators. Each of these contexts calls for the same six-stage productionisation framework, implemented to fit the operational geometry of the part of the value chain it serves.
The leadership mistake we see repeatedly
Asking 'can we use AI on our grid data?' instead of starting from the decision
The most common leadership question we hear in energy AI conversations is, can we use AI on our grid or generation data? Technically, yes. Operationally, the question rarely produces a useful programme. The better question reframes the conversation around the decision the AI is meant to improve.
Which operational decision are we trying to improve, and what speed, context, and reliability does that decision require? If the team can answer that question with reference to a specific operator, planner, dispatcher, or maintenance role, the AI capability has a chance of delivering value. If the team cannot, the result will be a model in search of a workflow, which is the failure pattern that produces successful pilots and unsuccessful production deployments.
Why this matters for energy leadership
The business outcomes that depend on energy AI being built correctly
For leaders in the energy sector, energy sector AI productionization investments deliver value when the pipeline reflects the distributed, time-sensitive, weather-influenced reality of energy operations. The outcomes that depend on this discipline include better load and generation forecasting, improved asset reliability across distributed renewable and grid portfolios, lower unplanned downtime, faster anomaly detection and grid event response, better renewable integration as variable generation becomes a larger share of the mix, stronger grid visibility, improved maintenance planning, better operational decision support for dispatchers and planners, and an AI capability that can scale across the operating estate rather than remaining trapped in pilots.
How CoffeeBeans helps
Building distributed, decision-aware AI for energy operations
CoffeeBeans works with power generation companies, renewable IPPs, grid operators, and energy infrastructure manufacturers to apply the AI Productionization Value Chain to energy sector realities. Our energy sector AI productionization engagements typically begin with the operational decision. Which dispatcher, planner, control room operator, or maintenance team will act on the model output, on what cadence, and with what reliability expectation? From that operational anchor, we work backward through the pipeline.
The data foundation in Stage 01 integrates SCADA, asset management, smart meter, weather, demand, and grid event sources into a time-synchronised, governed view. Power grid machine learning feature engineering in Stage 02 combines equipment signals with weather, demand, geographic, and temporal context. Stages 03 and 04 build models calibrated to the operational decision, with validation that covers rare events, seasonal variation, and operational risk. Utility AI deployment in Stage 05 chooses the right architecture (batch, real-time, edge, or hybrid) for the decision window and connects the model to the control room, field operations, or planning workflow that will actually use the output. Stage 06 keeps the model healthy as weather, demand, asset conditions, and grid configurations evolve. The objective is consistent: AI that delivers measurable value in forecasting, asset reliability, grid operations, and renewable integration, at the operating tempo the energy sector requires.
Is your AI built for a factory, or for a grid?
If your energy operation has rich SCADA, asset, smart meter, weather, and demand data but AI initiatives that struggle to translate into reliable forecasting, asset performance, or grid decision support, the gap is almost always in how the pipeline reflects the distributed, time-sensitive nature of energy operations. CoffeeBeans can help your team design the energy sector AI productionization foundation, build the power grid machine learning layer, and operationalise the utility AI deployment architecture your operational decisions actually require. Talk to our Enterprise AI practice about energy-aware AI in your operation.
Like What You’re Reading?
Subscribe to our newsletter to get the latest strategies, trends, and expert perspectives.
Similar Reads


Links
Subscribe
Newsletter
Sign up to learn about AI in the business world.
© 2026 CoffeeBeans. All Rights Reserved.