Is Model Drift Killing Your AI Projects? Here's How to Stop It
Enterprise AI projects fail primarily because organizations build models on weak data foundations. The most damaging symptom? Model drift—when production AI systems silently degrade in accuracy because the data infrastructure cannot maintain consistent, high-quality inputs over time. While the symptom appears during deployment, the root cause traces back to fragmented data sources, inadequate governance, and missing monitoring infrastructure.

15
min read

After working with enterprises across insurance, financial services, healthcare, and manufacturing, we've identified the pattern: Companies that invest in strong data foundations detect and prevent model drift before it impacts business outcomes. Those that don't watch their AI investments slowly fail.
What Makes Enterprise AI Projects Fail?
The 70% failure rate represents billions in wasted investment and lost competitive advantage. Here's what typically happens:
A company successfully builds a proof-of-concept. The model performs beautifully in testing. Leadership approves production deployment. Initial results match expectations.
Then, quietly and invisibly, performance begins degrading. By the time the business notices—through customer complaints, missed targets, or operational issues—the model has been making poor decisions for weeks or months.
The fundamental issue: Most organizations approach AI backwards. They start with models and algorithms, then discover their data infrastructure cannot sustain production-grade AI systems.
This isn't a model architecture problem. It's a data foundation problem.
What is Model Drift and Why Does It Destroy AI Projects?
Understanding Model Drift
Model drift occurs when a machine learning model's prediction accuracy degrades over time because the statistical properties of production data diverge from the data used during training.
Think of a retail demand forecasting model trained on 2019 shopping patterns. When COVID-19 hit, consumer behavior fundamentally changed. Store traffic plummeted while e-commerce surged. Shopping baskets shifted from impulse purchases to bulk buying. The model's understanding remained frozen in 2019, making increasingly inaccurate predictions throughout 2020.
The model didn't break. The world changed, but the model couldn't adapt.
Why Model Drift Happens
Model drift stems from the reality that business environments constantly evolve:
Customer behavior shifts: Purchase patterns, risk profiles, and engagement preferences change continuously. Yesterday's customer segmentation doesn't predict tomorrow's behavior.
Market dynamics evolve: Competitive actions, economic conditions, and industry trends alter the relationships between features and outcomes that models rely on.
Business changes: New products, pricing strategies, geographic expansion, or operational changes introduce data patterns the model has never encountered.
Seasonal variations: Many models are trained on insufficient historical data to capture annual, quarterly, or even weekly cyclicality.
External disruptions: Regulatory changes, technological shifts, or unexpected events (pandemics, natural disasters, supply chain disruptions) fundamentally transform the environment.
The Real Cost of Model Drift
Model drift doesn't announce itself. It erodes value silently until the damage becomes visible.
Financial Services Example:
A major bank deployed a fraud detection model achieving 94% accuracy at launch. Six months later, accuracy had dropped to 67%—but they didn't realize it until customer complaints about false positives surged and fraud losses spiked simultaneously.
Why? Fraudsters continuously evolve tactics. The model kept applying detection patterns from six months ago while fraud rings had moved to entirely new approaches.
The business impact:
$3.2 million in undetected fraudulent transactions
23% increase in false positives blocking legitimate customers
Reputation damage requiring extensive remediation
Three weeks of emergency model retraining disrupting operations
Loss of customer trust requiring months to rebuild
Healthcare Example:
A hospital system implemented a patient readmission risk model to optimize discharge planning. Initial results were excellent—they successfully reduced 30-day readmissions by 18%.
Twelve months later, readmission rates had climbed back to baseline levels. Investigation revealed the model's accuracy had degraded significantly. The culprit? Changes in the hospital's patient population demographics and new chronic disease treatment protocols had shifted the underlying data distributions.
Manufacturing Example:
An industrial manufacturer deployed predictive maintenance models across production lines, initially reducing unplanned downtime by 34%. After 18 months, false alert rates had tripled while the system missed critical failures it should have caught.
The cause? Normal equipment aging changed vibration patterns and sensor readings. The model, trained on newer equipment, couldn't recognize these evolved signatures as normal operation versus impending failure.
Where Model Drift Actually Comes From: Data Foundation Gaps
Model drift appears to be a modeling challenge. The instinctive response? "Let's retrain the model more frequently." Or "Let's try a more sophisticated algorithm."
These approaches treat symptoms while ignoring the disease.
Model drift is fundamentally a data infrastructure problem.
Here's why organizations experience drift—and why some don't:
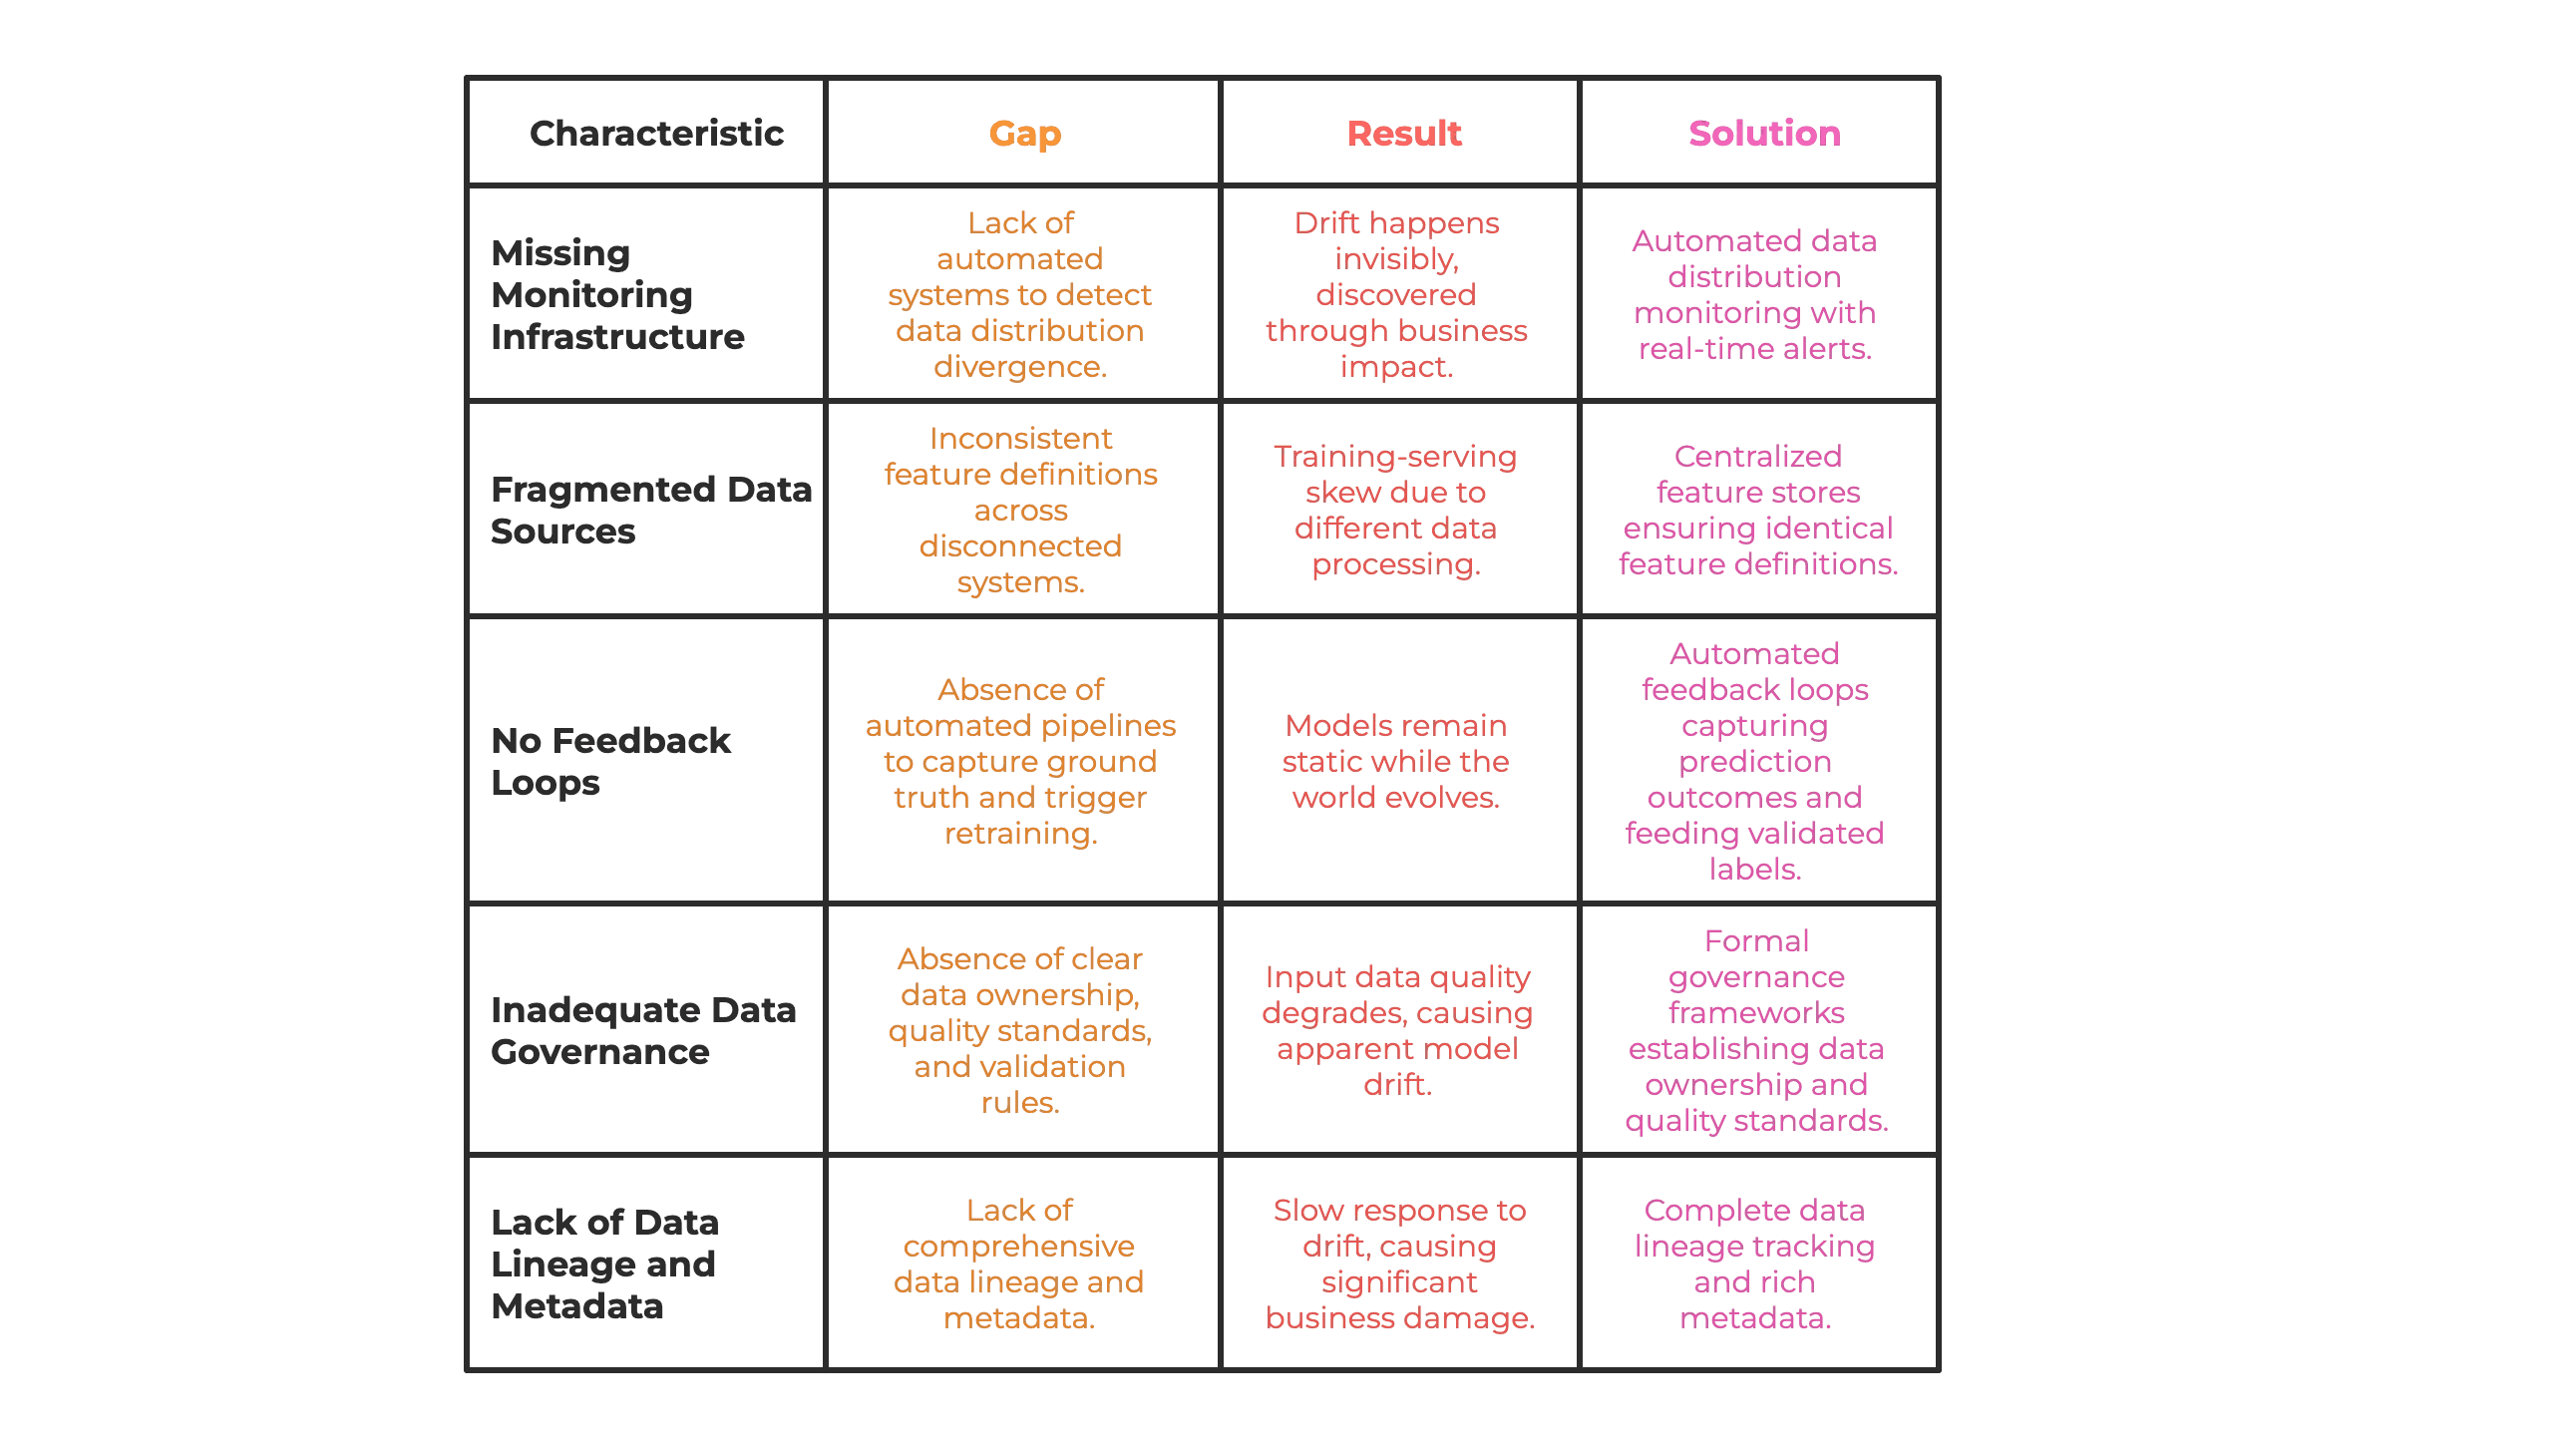
How Strong Data Foundations Prevent Model Drift
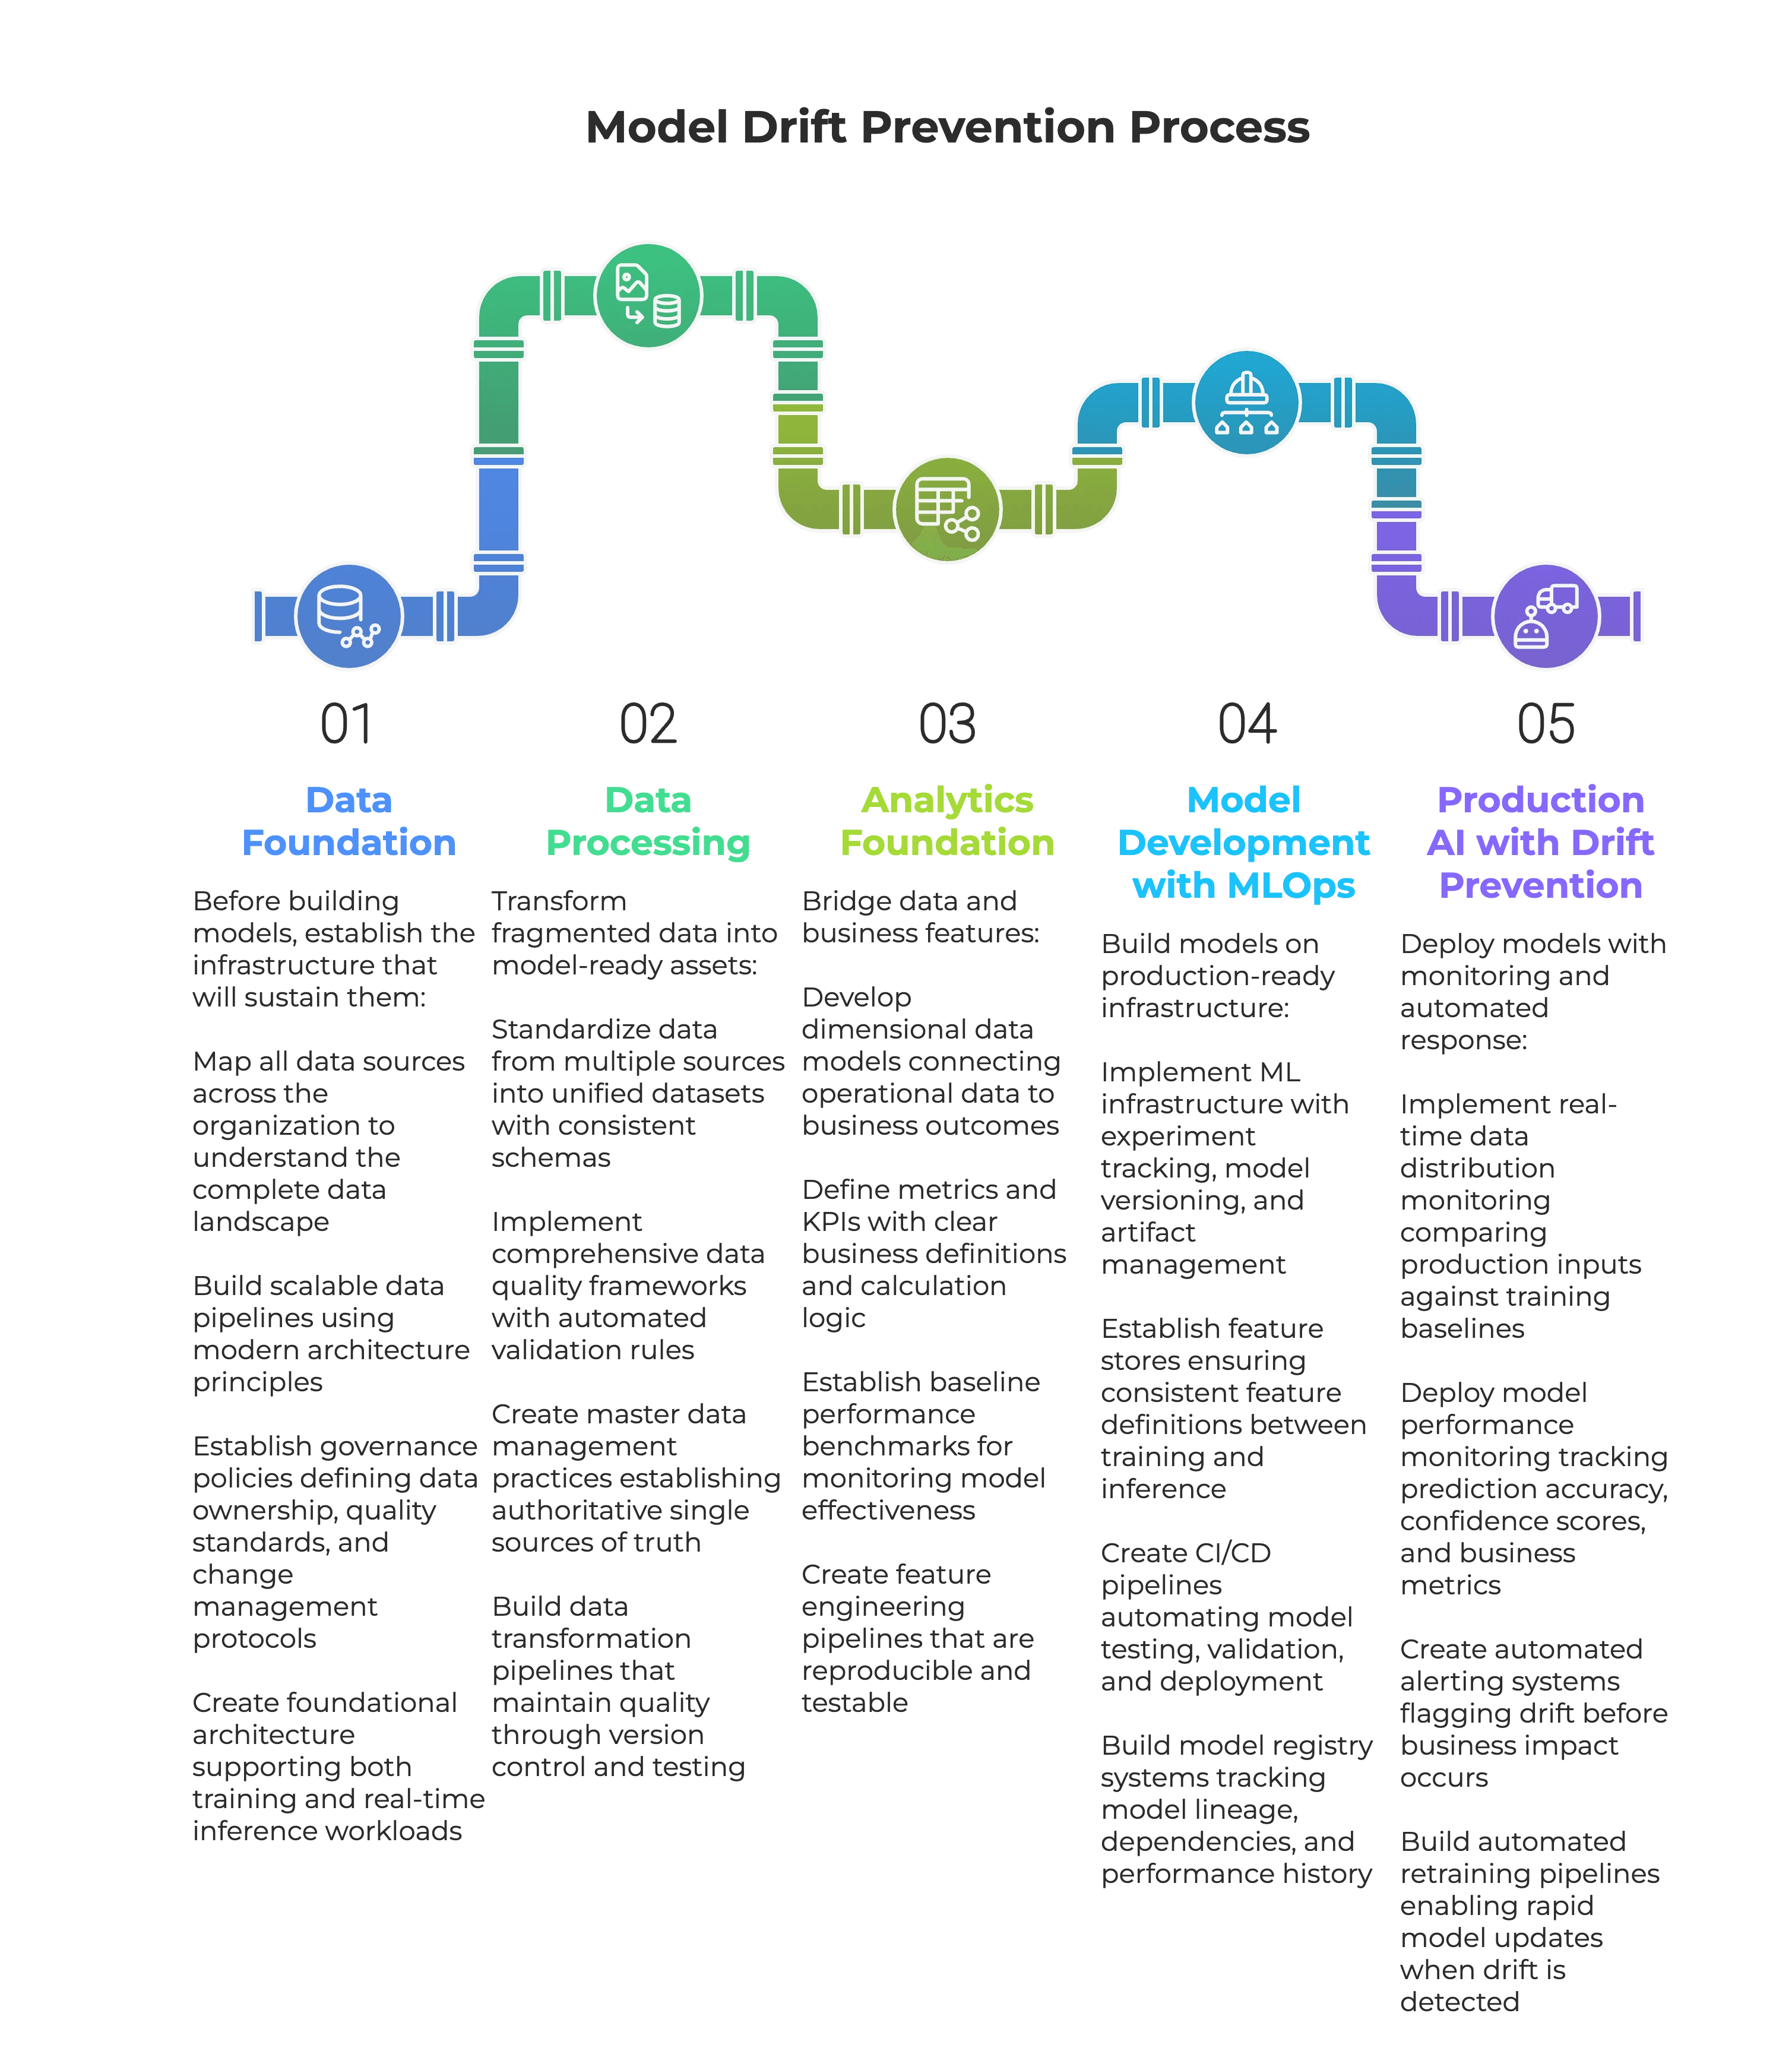
The CoffeeBeans Approach: Building Drift-Resistant AI Infrastructure
Our experience working across industries has revealed that preventing model drift requires a systematic, five-stage approach:
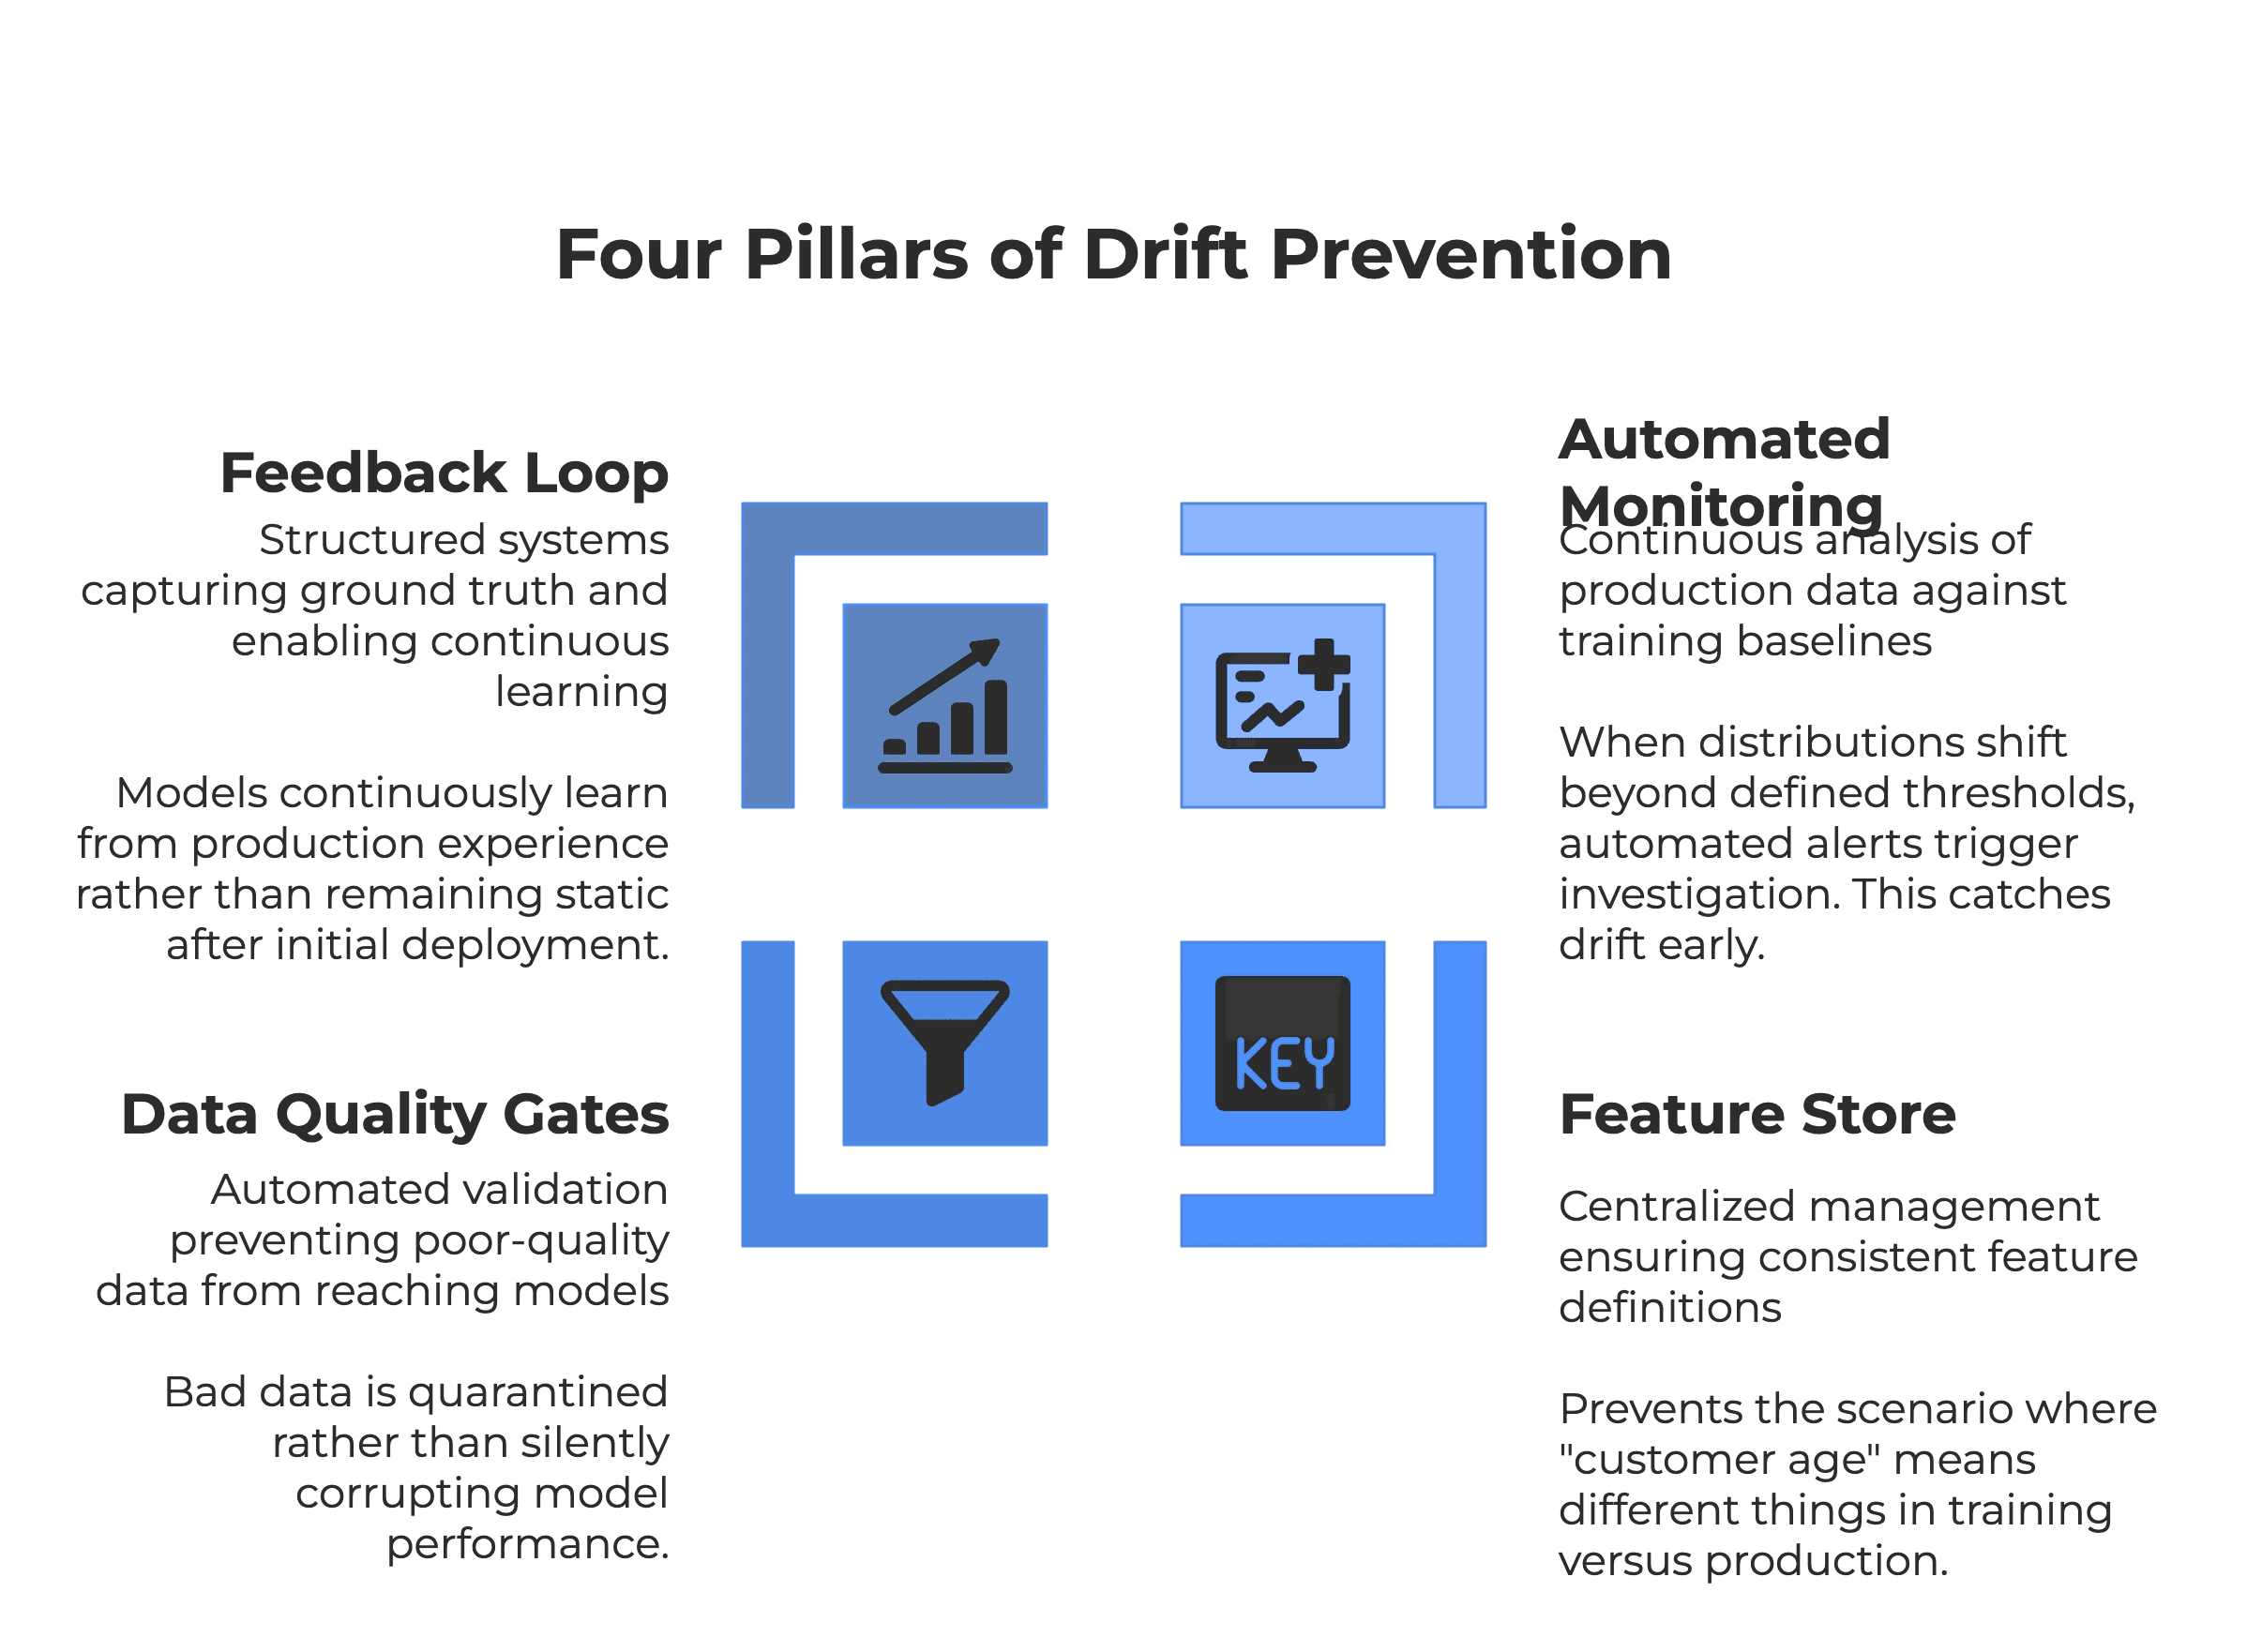
Four Pillars of Drift Prevention
Real Results: Preventing Model Drift at Scale
Case Study: Insurance Carrier Transformation
A digital-first insurance provider processing 400,000+ policies faced a critical challenge: they couldn't deploy ML models fast enough to respond to market changes, and when they did deploy models, they had no systematic way to detect performance degradation.
The symptoms:
7-week model deployment cycles creating competitive disadvantage
No visibility into model performance after deployment
Manual underwriting consuming excessive resources because models couldn't be trusted
Inability to predict catastrophic event claims due to rapidly changing risk patterns
The root cause analysis revealed:
Not a data science problem—a data foundation problem:
Fragmented data across multiple systems with inconsistent definitions
No feature store creating training-serving skew
Manual data preparation introducing errors and delays
Zero automated monitoring of data distributions or model performance
No infrastructure for rapid model retraining when drift occurred
Our systematic approach:
Data Foundation (Months 1-2):
Implemented unified data platform on Databricks
Established governance policies and data quality standards
Built automated data pipelines with quality gates
Created comprehensive data lineage tracking
MLOps Infrastructure (Months 2-3):
Implemented feature store for consistent feature definitions
Deployed model registry with versioning and lineage
Built CI/CD pipelines enabling automated testing and deployment
Created monitoring dashboards tracking data and model drift
Production Deployment (Month 4+):
Deployed 6 production ML models with full monitoring
Established automated retraining triggers based on drift detection
Integrated models into live underwriting and claims workflows
Enabled self-service model deployment for data science team
Quantified Results:
90% reduction in model deployment time (from 7 weeks to same-day)
Feature store eliminated redundant feature engineering
Automated pipelines removed manual data preparation
CI/CD infrastructure enabled confident, rapid releases
$1.2M in avoided losses through predictive models that stay accurate
Hurricane claims prediction model with 85% recall maintained through continuous monitoring
Large loss blocker model preventing catastrophic underwriting errors
Drift detection enabling proactive retraining before performance degraded
60% reduction in manual underwriting reviews
Automated risk scoring freed underwriters for complex cases
Model reliability improvements enabled higher straight-through processing rates
Consistent feature definitions eliminated scoring inconsistencies
7 percentage point improvement in loss ratio
More accurate risk assessment through better data quality
Real-time model updates responding to changing risk patterns
Wind mitigation scoring (0.92 AUC) that remains calibrated over time
The critical differentiator: We didn't just build models. We built the data infrastructure that prevents drift and enables sustainable AI operations.
Cross-Industry Drift Prevention Results
The pattern repeats across sectors. Strong data foundations enable drift-resistant AI:
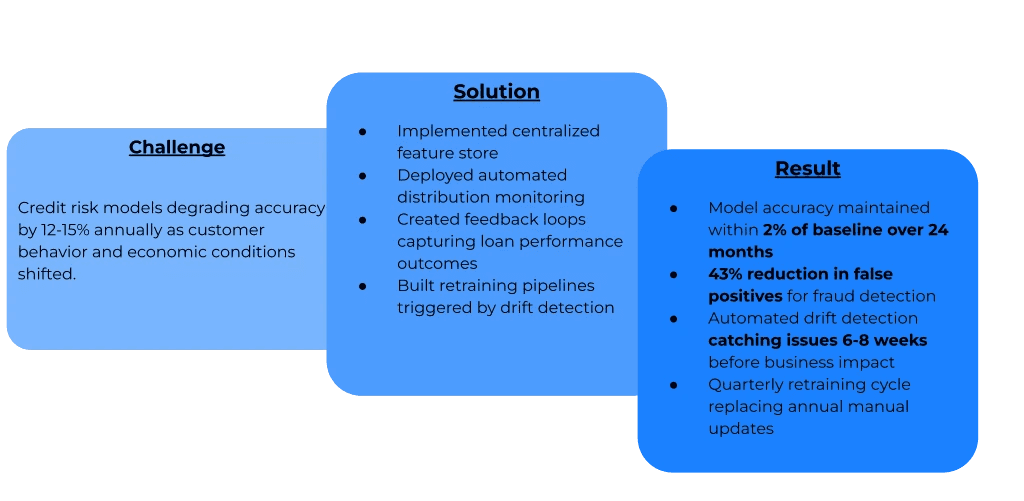
Financial Services: Regional Bank
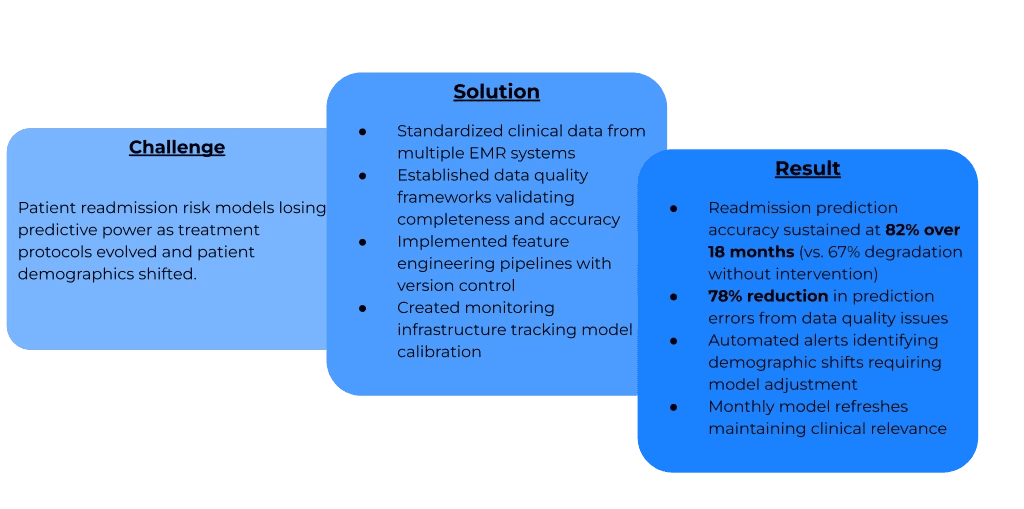
Healthcare: Hospital System
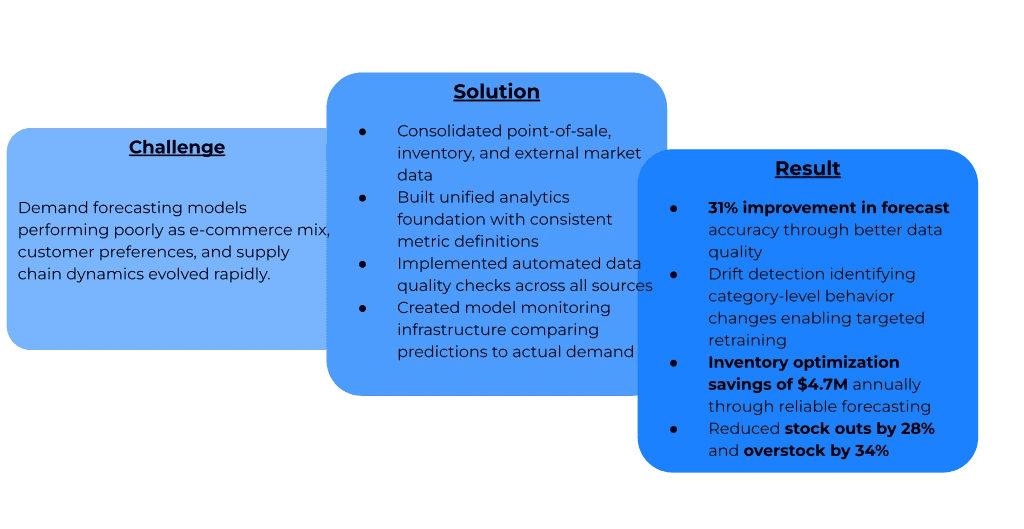
Retail: Specialty Retailer
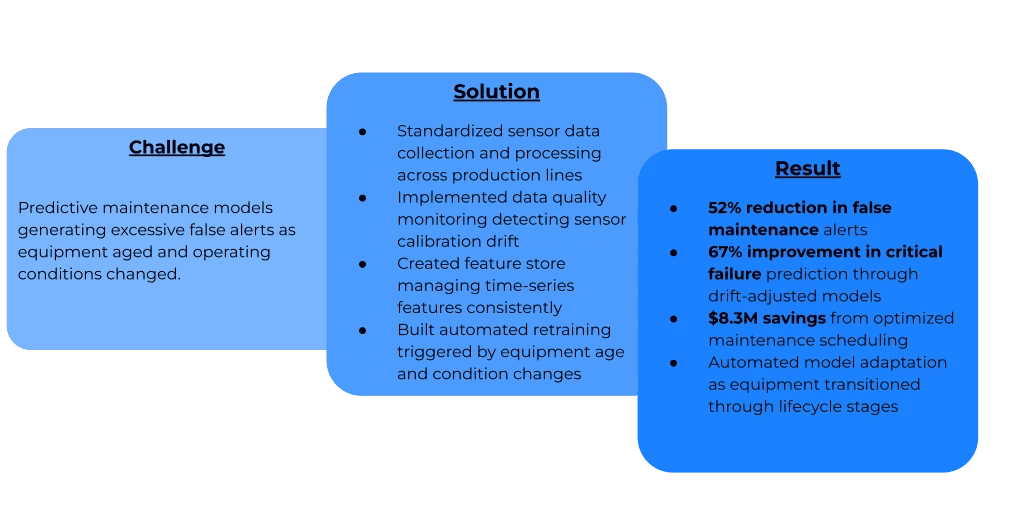
Manufacturing: Industrial Equipment Manufacturer
The Common Thread:
Organizations that solve the data foundation problem first create infrastructure that naturally prevents drift. Those that treat drift as a modeling challenge continue struggling indefinitely.
FAQ: Common Questions About Model Drift and Data Foundations
How do I know if my models are experiencing drift?
Warning signs of model drift:
Performance indicators:
Gradual decline in prediction accuracy over time
Increasing error rates on specific customer segments or product categories
Growing gap between model confidence scores and actual outcomes
Business metrics (conversion rates, fraud losses, maintenance costs) deviating from model-predicted values
Data indicators:
Production feature distributions shifting from training baselines
New categorical values appearing that weren't in training data
Increasing null or missing values in key features
Changes in correlations between features
Operational indicators:
More frequent exceptions requiring manual intervention
Increasing stakeholder questions about model recommendations
Growing discrepancy between model outputs and business intuition
Rising customer complaints related to AI-driven decisions
The challenge: Without automated monitoring infrastructure, you typically discover drift only after business impact occurs. Strong data foundations enable proactive drift detection weeks or months before performance degradation becomes visible.
Can't I just retrain my models more frequently to prevent drift?
Short answer: Frequent retraining treats symptoms, not root causes.
Retraining without proper data foundations creates a cycle of diminishing returns:
The retraining trap:
Each retraining cycle faces the same data quality issues
Inconsistent feature definitions create training-serving skew
Manual data preparation introduces errors and delays
No systematic capture of ground truth for validation
Lack of monitoring means you don't know when retraining is actually needed
Result: You're constantly firefighting without addressing underlying infrastructure problems.
The proper approach:
Build monitoring infrastructure detecting drift early, then use automated pipelines enabling safe, rapid retraining when truly needed:
Automated drift detection identifying when retraining would be beneficial
Feature stores ensuring consistent data between training and production
Data quality gates preventing bad data from corrupting new model versions
Automated feedback loops capturing ground truth for validation
CI/CD pipelines enabling confident, tested model updates
Bottom line: Fix the foundation first. Then retraining becomes a controlled, automated response to detected drift rather than an emergency intervention.
What types of model drift should I monitor?
Understanding different drift types helps target monitoring efforts:
Data Drift (Covariate Shift):
The distribution of input features changes while the relationship between features and target remains constant
Example: Customer age distribution shifts older, but the relationship between age and purchase probability stays the same
Detection: Monitor feature distributions using statistical tests (KS test, PSI, etc.)
Response: May require retraining on new data distribution or adjusting model calibration
Concept Drift:
The relationship between input features and target variable changes
Example: Economic recession changes how income level predicts loan default risk
Detection: Monitor model performance metrics (accuracy, precision, recall, calibration)
Response: Requires model retraining with updated relationships
Label Drift:
The distribution of the target variable itself changes
Example: Fraud attempts shift from credit card to wire transfer, changing fraud type distribution
Detection: Monitor target variable distribution in predictions and (when available) ground truth
Response: Collect updated training data representing new target distribution
Upstream Data Changes:
Changes in source systems, data pipelines, or ETL processes alter data without real-world changes
Example: System upgrade changes timestamp format, breaking feature calculations
Detection: Data lineage tracking and schema validation
Response: Fix pipeline issues rather than retraining models
Most organizations need monitoring across all types since production models face multiple drift sources simultaneously.
How long does it take to build data foundations that prevent drift?
Realistic timeline: 4-6 months for initial foundation with ongoing enhancement.
However, we use a parallel approach delivering business value quickly while building sustainable infrastructure:
Month 1-2: Core Data Foundation
Map data sources and assess current state
Establish governance policies and data quality standards
Build initial data pipelines for priority use cases
Implement foundational architecture (data platform, storage, processing)
Month 2-3: MLOps Infrastructure (Parallel Track)
Deploy feature store for consistent feature management
Implement model registry and versioning systems
Create CI/CD pipelines for automated deployment
Build monitoring infrastructure for data and model drift
Month 3-4: Initial Production Deployment
Deploy first models with full monitoring capabilities
Validate drift detection and alerting systems
Train teams on MLOps workflows
Document standards and best practices
Month 4-6: Expansion and Automation
Extend infrastructure to additional use cases
Automate retraining workflows
Enhance monitoring and alerting
Build self-service capabilities for data science teams
Ongoing: Continuous Evolution
Add new data sources as needed
Expand monitoring coverage
Refine automated responses to drift
Incorporate feedback from production experience
Key principle: We don't wait until everything is perfect. We build enough foundation to deploy reliably, then expand capabilities iteratively while delivering business value.
What if I've already deployed models without drift monitoring?
You're not alone—most organizations are in this position.
Recommended approach:
Phase 1: Risk Assessment (Weeks 1-2)
Inventory all production models
Assess business criticality and failure impact
Evaluate current monitoring capabilities
Identify models most susceptible to drift
Phase 2: Emergency Monitoring (Weeks 2-4)
Implement basic drift monitoring for high-risk models
Create manual processes for performance tracking
Establish alerting for critical issues
Document current model behavior as baseline
Phase 3: Foundation Building (Months 2-4)
Build data infrastructure supporting proper monitoring
Implement feature stores for critical models
Create automated quality gates
Deploy comprehensive drift detection
Phase 4: Systematic Enhancement (Months 4-6)
Extend monitoring to all production models
Automate retraining workflows
Build feedback loops capturing ground truth
Establish sustainable MLOps practices
Prioritization criteria:
Models affecting revenue or customer experience first
Models with regulatory implications second
Models with visible performance degradation third
Other models as resources allow
Pragmatic reality: You can't fix everything overnight. Focus on preventing catastrophic failures while systematically building proper foundations.
How do I convince leadership to invest in data foundations instead of just deploying more models?
Frame it as risk mitigation and accelerated ROI:
The cost of weak foundations:
70% project failure rate represents billions in wasted AI investment across the industry
Silent model drift causes gradual business damage (fraud losses, missed revenue, poor customer experience)
Manual firefighting consumes data science talent that could be building competitive advantage
Slow deployment cycles create competitive disadvantage
Accumulated technical debt makes every future AI initiative harder
The value proposition of strong foundations:
Speed: 90% faster model deployment (proven results) means more AI initiatives reaching production Reliability: Models maintain performance over time rather than silently degrading Scalability: Infrastructure supports multiple AI initiatives without rebuilding for each Risk reduction: Drift detection prevents business damage before it occurs Cost efficiency: Automated workflows replace manual intervention Competitive advantage: Faster innovation cycle than competitors stuck in AI project failures
Concrete business cases:
Present the math:
Current state: 7-week deployment, unknown drift, manual monitoring
Future state: Same-day deployment, automated drift detection, proactive response
Business impact: $1.2M prevented losses, 60% manual work reduction, 7pp margin improvement
Risk comparison:
"Would you deploy a fraud detection model with no monitoring, hoping it stays accurate?" versus "Would you deploy with automated drift detection catching issues before losses occur?"
The conversation closer:
"We can keep building AI projects on weak foundations and joining the 70% failure rate, or we can invest 4-6 months building infrastructure that makes every future AI initiative 90% faster to deploy and dramatically more likely to succeed. Which creates more competitive advantage?"
What metrics should I monitor to detect model drift?
Comprehensive drift detection requires monitoring across multiple dimensions:
Data Distribution Metrics:
For numerical features:
Mean and standard deviation shifts
Percentile changes (P10, P25, P50, P75, P90)
Population Stability Index (PSI) comparing training vs. production distributions
Kolmogorov-Smirnov (KS) test detecting distribution changes
Coefficient of variation tracking relative variability
For categorical features:
Frequency distribution changes
New categorical values not seen in training
Chi-square test comparing category distributions
Entropy changes indicating distribution shifts
Model Performance Metrics:
Classification models:
Accuracy, precision, recall, F1-score over time
Area Under ROC Curve (AUC-ROC) trends
Calibration metrics (Brier score, calibration error)
Confusion matrix changes
Class-specific performance by segment
Regression models:
Mean Absolute Error (MAE) and Root Mean Square Error (RMSE) trends
R-squared evolution
Residual distribution analysis
Prediction bias (over/under-prediction patterns)
Segment-specific error rates
Prediction Distribution Metrics:
Score/probability distribution shifts
Prediction confidence changes
Output value range evolution
Segment-level prediction patterns
Business Metrics:
Actual business outcomes vs. model predictions
Conversion rates, fraud losses, maintenance costs, or domain-specific KPIs
Cost of model errors (false positives vs. false negatives)
Operational efficiency metrics (straight-through processing rates, manual intervention frequency)
Data Quality Metrics:
Null/missing value rates
Duplicate records
Outlier frequency
Schema violations
Data freshness/latency
Best practice: Monitor all dimensions with automated alerting when any metric crosses predefined thresholds. Different drift types manifest in different metric patterns.
The Path Forward: Building AI That Stays Accurate
The 70% AI project failure rate isn't inevitable—it's the predictable outcome of building models on infrastructure designed for static reporting, not dynamic production AI.
Model drift is the silent killer of AI initiatives. It doesn't announce itself through catastrophic failures. Instead, it erodes value gradually: accuracy drops from 94% to 87% to 78%, each percentage point representing lost revenue, increased risk, or degraded customer experience.
By the time the business notices the problem, months of damage have accumulated.
The fundamental truth organizations must accept:
No amount of algorithmic sophistication can compensate for weak data foundations. The most advanced model architecture becomes unreliable when:
Feature definitions differ between training and production
Data quality degrades without detection
Distribution shifts go unmonitored
Ground truth feedback never reaches the retraining process
Pipeline failures silently corrupt model inputs
What separates successful AI organizations from the 70% that fail?
They understand that preventing model drift isn't a modeling challenge—it's an infrastructure challenge. The path to sustainable AI success requires investing in foundational capabilities before scaling model deployment:
Unified data architecture consolidating fragmented sources into coherent, governed systems
Feature stores ensuring consistent feature definitions across the entire ML lifecycle
Automated quality gates preventing degraded data from reaching production models
Comprehensive monitoring infrastructure detecting drift before business impact
MLOps platforms enabling rapid, confident model updates when drift occurs
Feedback loops capturing ground truth and driving continuous improvement
This foundation work doesn't generate exciting headlines or impressive demos. But it makes AI actually work in production over months and years, not just weeks.
The CoffeeBeans Difference:
Our experience across insurance, financial services, healthcare, and manufacturing has revealed that while industries differ in domain specifics, the foundation principles remain universal. Model drift challenges you face in fraud detection parallel those in predictive maintenance, demand forecasting, or patient risk stratification.
We don't just build AI models—we build your capability to sustain AI success over time. That starts with data foundations designed to:
Detect drift before it causes business damage
Enable rapid response when conditions change
Scale to support dozens or hundreds of models
Reduce from months to days the time required to deploy updates
Free data science teams from firefighting to focus on innovation
The transformation is measurable:
From 7-week deployments to same-day releases
From silent drift to proactive detection 6-8 weeks early
From emergency retraining to automated, tested updates
From 70% failure rates to 90%+ success rates
From millions in losses to millions in prevented damages
Strong data foundations transform AI from an expensive science project into reliable competitive advantage.
After working with enterprises across insurance, financial services, healthcare, and manufacturing, we've identified the pattern: Companies that invest in strong data foundations detect and prevent model drift before it impacts business outcomes. Those that don't watch their AI investments slowly fail.
What Makes Enterprise AI Projects Fail?
The 70% failure rate represents billions in wasted investment and lost competitive advantage. Here's what typically happens:
A company successfully builds a proof-of-concept. The model performs beautifully in testing. Leadership approves production deployment. Initial results match expectations.
Then, quietly and invisibly, performance begins degrading. By the time the business notices—through customer complaints, missed targets, or operational issues—the model has been making poor decisions for weeks or months.
The fundamental issue: Most organizations approach AI backwards. They start with models and algorithms, then discover their data infrastructure cannot sustain production-grade AI systems.
This isn't a model architecture problem. It's a data foundation problem.
What is Model Drift and Why Does It Destroy AI Projects?
Understanding Model Drift
Model drift occurs when a machine learning model's prediction accuracy degrades over time because the statistical properties of production data diverge from the data used during training.
Think of a retail demand forecasting model trained on 2019 shopping patterns. When COVID-19 hit, consumer behavior fundamentally changed. Store traffic plummeted while e-commerce surged. Shopping baskets shifted from impulse purchases to bulk buying. The model's understanding remained frozen in 2019, making increasingly inaccurate predictions throughout 2020.
The model didn't break. The world changed, but the model couldn't adapt.
Why Model Drift Happens
Model drift stems from the reality that business environments constantly evolve:
Customer behavior shifts: Purchase patterns, risk profiles, and engagement preferences change continuously. Yesterday's customer segmentation doesn't predict tomorrow's behavior.
Market dynamics evolve: Competitive actions, economic conditions, and industry trends alter the relationships between features and outcomes that models rely on.
Business changes: New products, pricing strategies, geographic expansion, or operational changes introduce data patterns the model has never encountered.
Seasonal variations: Many models are trained on insufficient historical data to capture annual, quarterly, or even weekly cyclicality.
External disruptions: Regulatory changes, technological shifts, or unexpected events (pandemics, natural disasters, supply chain disruptions) fundamentally transform the environment.
The Real Cost of Model Drift
Model drift doesn't announce itself. It erodes value silently until the damage becomes visible.
Financial Services Example:
A major bank deployed a fraud detection model achieving 94% accuracy at launch. Six months later, accuracy had dropped to 67%—but they didn't realize it until customer complaints about false positives surged and fraud losses spiked simultaneously.
Why? Fraudsters continuously evolve tactics. The model kept applying detection patterns from six months ago while fraud rings had moved to entirely new approaches.
The business impact:
$3.2 million in undetected fraudulent transactions
23% increase in false positives blocking legitimate customers
Reputation damage requiring extensive remediation
Three weeks of emergency model retraining disrupting operations
Loss of customer trust requiring months to rebuild
Healthcare Example:
A hospital system implemented a patient readmission risk model to optimize discharge planning. Initial results were excellent—they successfully reduced 30-day readmissions by 18%.
Twelve months later, readmission rates had climbed back to baseline levels. Investigation revealed the model's accuracy had degraded significantly. The culprit? Changes in the hospital's patient population demographics and new chronic disease treatment protocols had shifted the underlying data distributions.
Manufacturing Example:
An industrial manufacturer deployed predictive maintenance models across production lines, initially reducing unplanned downtime by 34%. After 18 months, false alert rates had tripled while the system missed critical failures it should have caught.
The cause? Normal equipment aging changed vibration patterns and sensor readings. The model, trained on newer equipment, couldn't recognize these evolved signatures as normal operation versus impending failure.
Where Model Drift Actually Comes From: Data Foundation Gaps
Model drift appears to be a modeling challenge. The instinctive response? "Let's retrain the model more frequently." Or "Let's try a more sophisticated algorithm."
These approaches treat symptoms while ignoring the disease.
Model drift is fundamentally a data infrastructure problem.
Here's why organizations experience drift—and why some don't:
How Strong Data Foundations Prevent Model Drift
The CoffeeBeans Approach: Building Drift-Resistant AI Infrastructure
Our experience working across industries has revealed that preventing model drift requires a systematic, five-stage approach:
Four Pillars of Drift Prevention
Real Results: Preventing Model Drift at Scale
Case Study: Insurance Carrier Transformation
A digital-first insurance provider processing 400,000+ policies faced a critical challenge: they couldn't deploy ML models fast enough to respond to market changes, and when they did deploy models, they had no systematic way to detect performance degradation.
The symptoms:
7-week model deployment cycles creating competitive disadvantage
No visibility into model performance after deployment
Manual underwriting consuming excessive resources because models couldn't be trusted
Inability to predict catastrophic event claims due to rapidly changing risk patterns
The root cause analysis revealed:
Not a data science problem—a data foundation problem:
Fragmented data across multiple systems with inconsistent definitions
No feature store creating training-serving skew
Manual data preparation introducing errors and delays
Zero automated monitoring of data distributions or model performance
No infrastructure for rapid model retraining when drift occurred
Our systematic approach:
Data Foundation (Months 1-2):
Implemented unified data platform on Databricks
Established governance policies and data quality standards
Built automated data pipelines with quality gates
Created comprehensive data lineage tracking
MLOps Infrastructure (Months 2-3):
Implemented feature store for consistent feature definitions
Deployed model registry with versioning and lineage
Built CI/CD pipelines enabling automated testing and deployment
Created monitoring dashboards tracking data and model drift
Production Deployment (Month 4+):
Deployed 6 production ML models with full monitoring
Established automated retraining triggers based on drift detection
Integrated models into live underwriting and claims workflows
Enabled self-service model deployment for data science team
Quantified Results:
90% reduction in model deployment time (from 7 weeks to same-day)
Feature store eliminated redundant feature engineering
Automated pipelines removed manual data preparation
CI/CD infrastructure enabled confident, rapid releases
$1.2M in avoided losses through predictive models that stay accurate
Hurricane claims prediction model with 85% recall maintained through continuous monitoring
Large loss blocker model preventing catastrophic underwriting errors
Drift detection enabling proactive retraining before performance degraded
60% reduction in manual underwriting reviews
Automated risk scoring freed underwriters for complex cases
Model reliability improvements enabled higher straight-through processing rates
Consistent feature definitions eliminated scoring inconsistencies
7 percentage point improvement in loss ratio
More accurate risk assessment through better data quality
Real-time model updates responding to changing risk patterns
Wind mitigation scoring (0.92 AUC) that remains calibrated over time
The critical differentiator: We didn't just build models. We built the data infrastructure that prevents drift and enables sustainable AI operations.
Cross-Industry Drift Prevention Results
The pattern repeats across sectors. Strong data foundations enable drift-resistant AI:
Financial Services: Regional Bank
Healthcare: Hospital System
Retail: Specialty Retailer
Manufacturing: Industrial Equipment Manufacturer
The Common Thread:
Organizations that solve the data foundation problem first create infrastructure that naturally prevents drift. Those that treat drift as a modeling challenge continue struggling indefinitely.
FAQ: Common Questions About Model Drift and Data Foundations
How do I know if my models are experiencing drift?
Warning signs of model drift:
Performance indicators:
Gradual decline in prediction accuracy over time
Increasing error rates on specific customer segments or product categories
Growing gap between model confidence scores and actual outcomes
Business metrics (conversion rates, fraud losses, maintenance costs) deviating from model-predicted values
Data indicators:
Production feature distributions shifting from training baselines
New categorical values appearing that weren't in training data
Increasing null or missing values in key features
Changes in correlations between features
Operational indicators:
More frequent exceptions requiring manual intervention
Increasing stakeholder questions about model recommendations
Growing discrepancy between model outputs and business intuition
Rising customer complaints related to AI-driven decisions
The challenge: Without automated monitoring infrastructure, you typically discover drift only after business impact occurs. Strong data foundations enable proactive drift detection weeks or months before performance degradation becomes visible.
Can't I just retrain my models more frequently to prevent drift?
Short answer: Frequent retraining treats symptoms, not root causes.
Retraining without proper data foundations creates a cycle of diminishing returns:
The retraining trap:
Each retraining cycle faces the same data quality issues
Inconsistent feature definitions create training-serving skew
Manual data preparation introduces errors and delays
No systematic capture of ground truth for validation
Lack of monitoring means you don't know when retraining is actually needed
Result: You're constantly firefighting without addressing underlying infrastructure problems.
The proper approach:
Build monitoring infrastructure detecting drift early, then use automated pipelines enabling safe, rapid retraining when truly needed:
Automated drift detection identifying when retraining would be beneficial
Feature stores ensuring consistent data between training and production
Data quality gates preventing bad data from corrupting new model versions
Automated feedback loops capturing ground truth for validation
CI/CD pipelines enabling confident, tested model updates
Bottom line: Fix the foundation first. Then retraining becomes a controlled, automated response to detected drift rather than an emergency intervention.
What types of model drift should I monitor?
Understanding different drift types helps target monitoring efforts:
Data Drift (Covariate Shift):
The distribution of input features changes while the relationship between features and target remains constant
Example: Customer age distribution shifts older, but the relationship between age and purchase probability stays the same
Detection: Monitor feature distributions using statistical tests (KS test, PSI, etc.)
Response: May require retraining on new data distribution or adjusting model calibration
Concept Drift:
The relationship between input features and target variable changes
Example: Economic recession changes how income level predicts loan default risk
Detection: Monitor model performance metrics (accuracy, precision, recall, calibration)
Response: Requires model retraining with updated relationships
Label Drift:
The distribution of the target variable itself changes
Example: Fraud attempts shift from credit card to wire transfer, changing fraud type distribution
Detection: Monitor target variable distribution in predictions and (when available) ground truth
Response: Collect updated training data representing new target distribution
Upstream Data Changes:
Changes in source systems, data pipelines, or ETL processes alter data without real-world changes
Example: System upgrade changes timestamp format, breaking feature calculations
Detection: Data lineage tracking and schema validation
Response: Fix pipeline issues rather than retraining models
Most organizations need monitoring across all types since production models face multiple drift sources simultaneously.
How long does it take to build data foundations that prevent drift?
Realistic timeline: 4-6 months for initial foundation with ongoing enhancement.
However, we use a parallel approach delivering business value quickly while building sustainable infrastructure:
Month 1-2: Core Data Foundation
Map data sources and assess current state
Establish governance policies and data quality standards
Build initial data pipelines for priority use cases
Implement foundational architecture (data platform, storage, processing)
Month 2-3: MLOps Infrastructure (Parallel Track)
Deploy feature store for consistent feature management
Implement model registry and versioning systems
Create CI/CD pipelines for automated deployment
Build monitoring infrastructure for data and model drift
Month 3-4: Initial Production Deployment
Deploy first models with full monitoring capabilities
Validate drift detection and alerting systems
Train teams on MLOps workflows
Document standards and best practices
Month 4-6: Expansion and Automation
Extend infrastructure to additional use cases
Automate retraining workflows
Enhance monitoring and alerting
Build self-service capabilities for data science teams
Ongoing: Continuous Evolution
Add new data sources as needed
Expand monitoring coverage
Refine automated responses to drift
Incorporate feedback from production experience
Key principle: We don't wait until everything is perfect. We build enough foundation to deploy reliably, then expand capabilities iteratively while delivering business value.
What if I've already deployed models without drift monitoring?
You're not alone—most organizations are in this position.
Recommended approach:
Phase 1: Risk Assessment (Weeks 1-2)
Inventory all production models
Assess business criticality and failure impact
Evaluate current monitoring capabilities
Identify models most susceptible to drift
Phase 2: Emergency Monitoring (Weeks 2-4)
Implement basic drift monitoring for high-risk models
Create manual processes for performance tracking
Establish alerting for critical issues
Document current model behavior as baseline
Phase 3: Foundation Building (Months 2-4)
Build data infrastructure supporting proper monitoring
Implement feature stores for critical models
Create automated quality gates
Deploy comprehensive drift detection
Phase 4: Systematic Enhancement (Months 4-6)
Extend monitoring to all production models
Automate retraining workflows
Build feedback loops capturing ground truth
Establish sustainable MLOps practices
Prioritization criteria:
Models affecting revenue or customer experience first
Models with regulatory implications second
Models with visible performance degradation third
Other models as resources allow
Pragmatic reality: You can't fix everything overnight. Focus on preventing catastrophic failures while systematically building proper foundations.
How do I convince leadership to invest in data foundations instead of just deploying more models?
Frame it as risk mitigation and accelerated ROI:
The cost of weak foundations:
70% project failure rate represents billions in wasted AI investment across the industry
Silent model drift causes gradual business damage (fraud losses, missed revenue, poor customer experience)
Manual firefighting consumes data science talent that could be building competitive advantage
Slow deployment cycles create competitive disadvantage
Accumulated technical debt makes every future AI initiative harder
The value proposition of strong foundations:
Speed: 90% faster model deployment (proven results) means more AI initiatives reaching production Reliability: Models maintain performance over time rather than silently degrading Scalability: Infrastructure supports multiple AI initiatives without rebuilding for each Risk reduction: Drift detection prevents business damage before it occurs Cost efficiency: Automated workflows replace manual intervention Competitive advantage: Faster innovation cycle than competitors stuck in AI project failures
Concrete business cases:
Present the math:
Current state: 7-week deployment, unknown drift, manual monitoring
Future state: Same-day deployment, automated drift detection, proactive response
Business impact: $1.2M prevented losses, 60% manual work reduction, 7pp margin improvement
Risk comparison:
"Would you deploy a fraud detection model with no monitoring, hoping it stays accurate?" versus "Would you deploy with automated drift detection catching issues before losses occur?"
The conversation closer:
"We can keep building AI projects on weak foundations and joining the 70% failure rate, or we can invest 4-6 months building infrastructure that makes every future AI initiative 90% faster to deploy and dramatically more likely to succeed. Which creates more competitive advantage?"
What metrics should I monitor to detect model drift?
Comprehensive drift detection requires monitoring across multiple dimensions:
Data Distribution Metrics:
For numerical features:
Mean and standard deviation shifts
Percentile changes (P10, P25, P50, P75, P90)
Population Stability Index (PSI) comparing training vs. production distributions
Kolmogorov-Smirnov (KS) test detecting distribution changes
Coefficient of variation tracking relative variability
For categorical features:
Frequency distribution changes
New categorical values not seen in training
Chi-square test comparing category distributions
Entropy changes indicating distribution shifts
Model Performance Metrics:
Classification models:
Accuracy, precision, recall, F1-score over time
Area Under ROC Curve (AUC-ROC) trends
Calibration metrics (Brier score, calibration error)
Confusion matrix changes
Class-specific performance by segment
Regression models:
Mean Absolute Error (MAE) and Root Mean Square Error (RMSE) trends
R-squared evolution
Residual distribution analysis
Prediction bias (over/under-prediction patterns)
Segment-specific error rates
Prediction Distribution Metrics:
Score/probability distribution shifts
Prediction confidence changes
Output value range evolution
Segment-level prediction patterns
Business Metrics:
Actual business outcomes vs. model predictions
Conversion rates, fraud losses, maintenance costs, or domain-specific KPIs
Cost of model errors (false positives vs. false negatives)
Operational efficiency metrics (straight-through processing rates, manual intervention frequency)
Data Quality Metrics:
Null/missing value rates
Duplicate records
Outlier frequency
Schema violations
Data freshness/latency
Best practice: Monitor all dimensions with automated alerting when any metric crosses predefined thresholds. Different drift types manifest in different metric patterns.
The Path Forward: Building AI That Stays Accurate
The 70% AI project failure rate isn't inevitable—it's the predictable outcome of building models on infrastructure designed for static reporting, not dynamic production AI.
Model drift is the silent killer of AI initiatives. It doesn't announce itself through catastrophic failures. Instead, it erodes value gradually: accuracy drops from 94% to 87% to 78%, each percentage point representing lost revenue, increased risk, or degraded customer experience.
By the time the business notices the problem, months of damage have accumulated.
The fundamental truth organizations must accept:
No amount of algorithmic sophistication can compensate for weak data foundations. The most advanced model architecture becomes unreliable when:
Feature definitions differ between training and production
Data quality degrades without detection
Distribution shifts go unmonitored
Ground truth feedback never reaches the retraining process
Pipeline failures silently corrupt model inputs
What separates successful AI organizations from the 70% that fail?
They understand that preventing model drift isn't a modeling challenge—it's an infrastructure challenge. The path to sustainable AI success requires investing in foundational capabilities before scaling model deployment:
Unified data architecture consolidating fragmented sources into coherent, governed systems
Feature stores ensuring consistent feature definitions across the entire ML lifecycle
Automated quality gates preventing degraded data from reaching production models
Comprehensive monitoring infrastructure detecting drift before business impact
MLOps platforms enabling rapid, confident model updates when drift occurs
Feedback loops capturing ground truth and driving continuous improvement
This foundation work doesn't generate exciting headlines or impressive demos. But it makes AI actually work in production over months and years, not just weeks.
The CoffeeBeans Difference:
Our experience across insurance, financial services, healthcare, and manufacturing has revealed that while industries differ in domain specifics, the foundation principles remain universal. Model drift challenges you face in fraud detection parallel those in predictive maintenance, demand forecasting, or patient risk stratification.
We don't just build AI models—we build your capability to sustain AI success over time. That starts with data foundations designed to:
Detect drift before it causes business damage
Enable rapid response when conditions change
Scale to support dozens or hundreds of models
Reduce from months to days the time required to deploy updates
Free data science teams from firefighting to focus on innovation
The transformation is measurable:
From 7-week deployments to same-day releases
From silent drift to proactive detection 6-8 weeks early
From emergency retraining to automated, tested updates
From 70% failure rates to 90%+ success rates
From millions in losses to millions in prevented damages
Strong data foundations transform AI from an expensive science project into reliable competitive advantage.
Like What You’re Reading?
Subscribe to our newsletter to get the latest strategies, trends, and expert perspectives.
Similar Reads


Links
Subscribe
Newsletter
Sign up to learn about AI in the business world.
© 2026 CoffeeBeans. All Rights Reserved.